Act 91 Analysis from Procedure Part B
advertisement

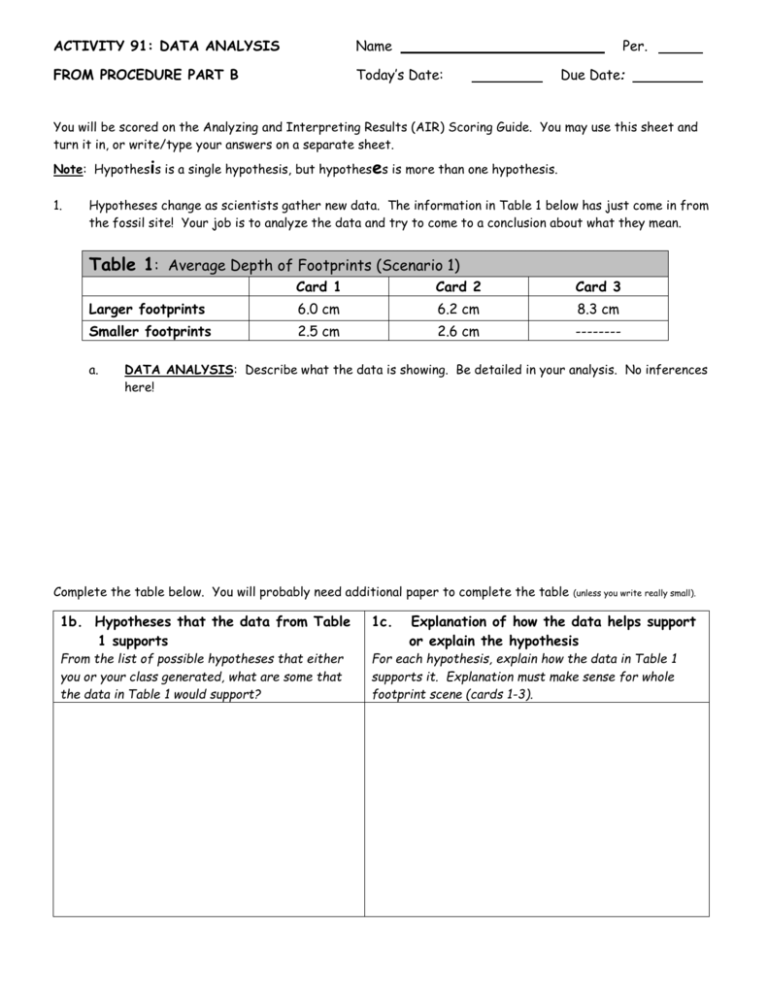
ACTIVITY 91: DATA ANALYSIS Name Per. FROM PROCEDURE PART B Today’s Date: Due Date: You will be scored on the Analyzing and Interpreting Results (AIR) Scoring Guide. You may use this sheet and turn it in, or write/type your answers on a separate sheet. Note: Hypothesis is a single hypothesis, but hypotheses is more than one hypothesis. 1. Hypotheses change as scientists gather new data. The information in Table 1 below has just come in from the fossil site! Your job is to analyze the data and try to come to a conclusion about what they mean. Table 1: Average Depth of Footprints (Scenario 1) Card 1 Card 2 Card 3 Larger footprints 6.0 cm 6.2 cm 8.3 cm Smaller footprints 2.5 cm 2.6 cm -------- a. DATA ANALYSIS: Describe what the data is showing. Be detailed in your analysis. No inferences here! Complete the table below. You will probably need additional paper to complete the table (unless you write really small). 1b. Hypotheses that the data from Table 1 supports 1c. Explanation of how the data helps support or explain the hypothesis From the list of possible hypotheses that either you or your class generated, what are some that the data in Table 1 would support? For each hypothesis, explain how the data in Table 1 supports it. Explanation must make sense for whole footprint scene (cards 1-3). 1b. Hypotheses that the data from Table 1 supports 1c. From the list of possible hypotheses that either you or your class generated, what are some that the data in Table 1 would support? For each hypothesis, explain how the data in Table 1 supports it. Explanation must make sense for whole footprint scene (cards 1-3). d. 2. Explanation of how the data helps support or explain the hypothesis CONCLUSION: From those hypotheses listed above, conclude which is the most likely scenario. Why is it better than the other ideas you came up with? Explain. Instead of the data from Table 1, imagine you have just received the data in Table 2 below: Table 2: Average Depth of Footprints (Scenario 2) Card 1 Card 2 Card 3 Larger footprints 6.0 cm 6.2 cm 6.1 cm Smaller footprints 2.5 cm 2.6 cm -------- a. DATA ANALYSIS: Describe what the data is showing. Be detailed in your analysis. No inferences here! Complete the table below. You will probably need additional paper to complete the table (unless you write really small). 2b. Hypotheses that the data from Table 2 supports 2c. Explanation of how the data helps support or explain the hypothesis From the list of possible hypotheses that either you or your class generated, what are some that the data in Table 2 would support? For each hypothesis, explain how the data in Table 2 supports it. Explanation must make sense for whole footprint scene (cards 1-3). d. 3. CONCLUSION: From those hypotheses listed above, conclude which is the most likely scenario. Why is it better than the other ideas you came up with? Explain. ERROR ANALYSIS: When making conclusions, scientists always consider what errors or other things could have affected the results. Here, you should think about what factors might explain the difference in the depth of the footprints in the different scenarios. In the spaces below, list some things that could have affected the results (either errors or other factors) and explain how those things would have affected the results. You may need additional paper for lengthier explanations. Factors that might affect results How those factors affect the results


