S2a. Genetic Linkage-Handout A1
advertisement
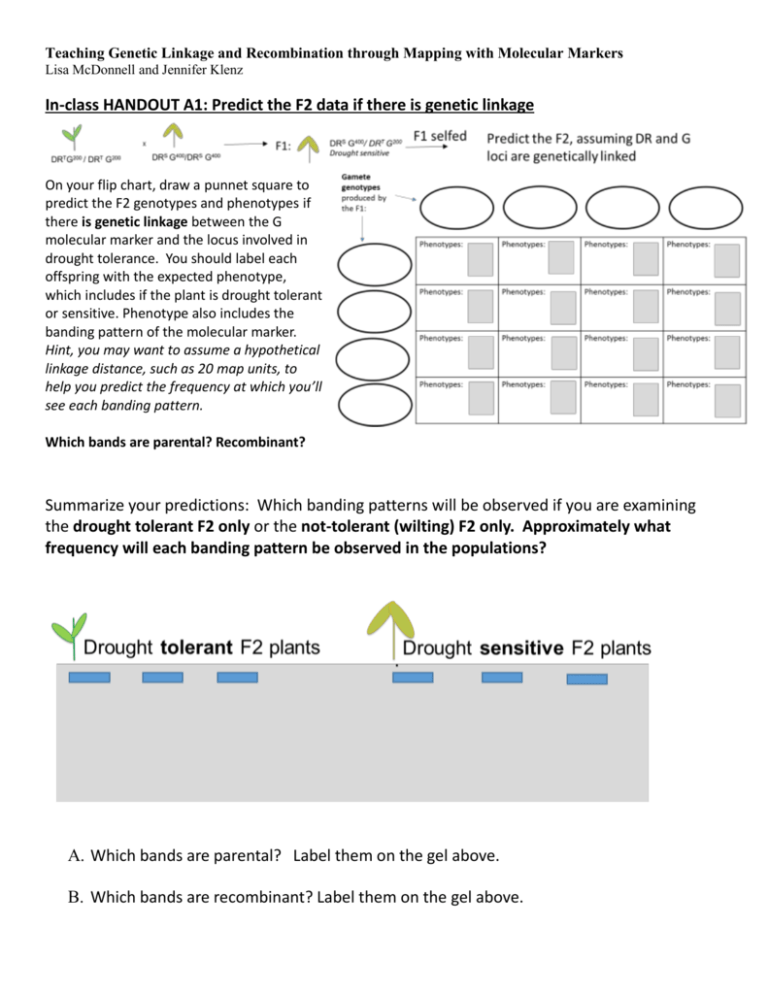
Teaching Genetic Linkage and Recombination through Mapping with Molecular Markers Lisa McDonnell and Jennifer Klenz In-class HANDOUT A1: Predict the F2 data if there is genetic linkage On your flip chart, draw a punnet square to predict the F2 genotypes and phenotypes if there is genetic linkage between the G molecular marker and the locus involved in drought tolerance. You should label each offspring with the expected phenotype, which includes if the plant is drought tolerant or sensitive. Phenotype also includes the banding pattern of the molecular marker. Hint, you may want to assume a hypothetical linkage distance, such as 20 map units, to help you predict the frequency at which you’ll see each banding pattern. Which bands are parental? Recombinant? Summarize your predictions: Which banding patterns will be observed if you are examining the drought tolerant F2 only or the not-tolerant (wilting) F2 only. Approximately what frequency will each banding pattern be observed in the populations? A. Which bands are parental? Label them on the gel above. B. Which bands are recombinant? Label them on the gel above. Teaching Genetic Linkage and Recombination through Mapping with Molecular Markers Lisa McDonnell and Jennifer Klenz C. If there was genetic linkage, which plants would you use to determine the linkage between the marker and the drought tolerance locus? Why?

