Supplement MTT assay Cell cultures were tested by the MTT assay
advertisement
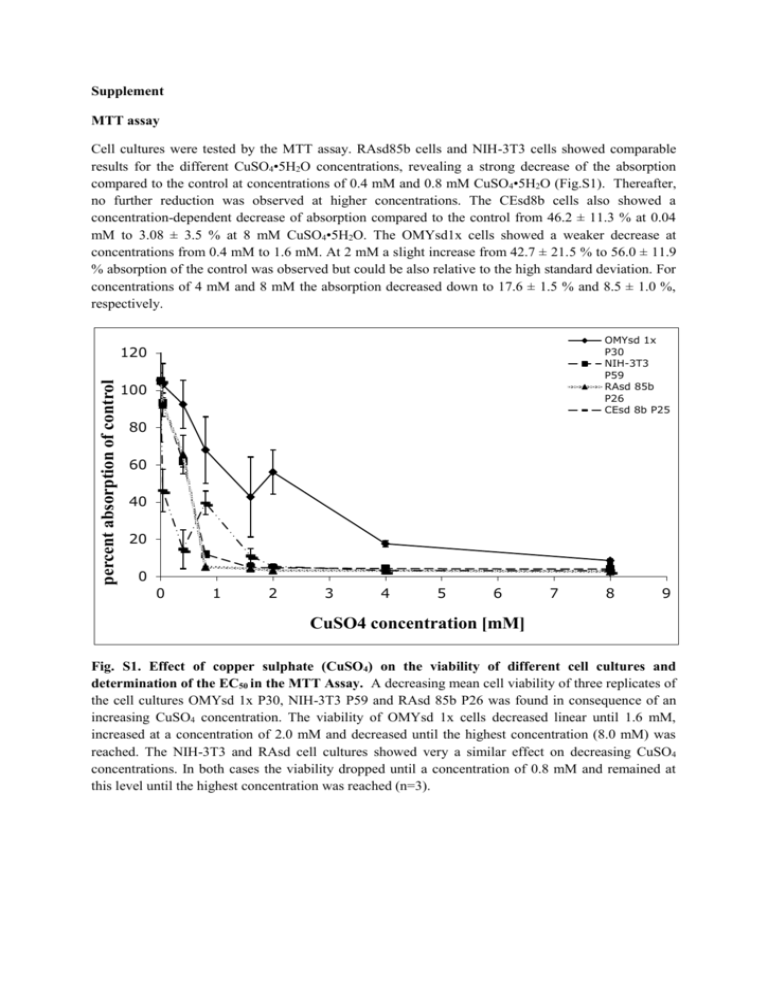
Supplement MTT assay Cell cultures were tested by the MTT assay. RAsd85b cells and NIH-3T3 cells showed comparable results for the different CuSO4•5H2O concentrations, revealing a strong decrease of the absorption compared to the control at concentrations of 0.4 mM and 0.8 mM CuSO4•5H2O (Fig.S1). Thereafter, no further reduction was observed at higher concentrations. The CEsd8b cells also showed a concentration-dependent decrease of absorption compared to the control from 46.2 ± 11.3 % at 0.04 mM to 3.08 ± 3.5 % at 8 mM CuSO4•5H2O. The OMYsd1x cells showed a weaker decrease at concentrations from 0.4 mM to 1.6 mM. At 2 mM a slight increase from 42.7 ± 21.5 % to 56.0 ± 11.9 % absorption of the control was observed but could be also relative to the high standard deviation. For concentrations of 4 mM and 8 mM the absorption decreased down to 17.6 ± 1.5 % and 8.5 ± 1.0 %, respectively. OMYsd 1x P30 NIH-3T3 P59 RAsd 85b P26 CEsd 8b P25 percent absorption of control 120 100 80 60 40 20 0 0 1 2 3 4 5 6 7 8 9 CuSO4 concentration [mM] Fig. S1. Effect of copper sulphate (CuSO4) on the viability of different cell cultures and determination of the EC50 in the MTT Assay. A decreasing mean cell viability of three replicates of the cell cultures OMYsd 1x P30, NIH-3T3 P59 and RAsd 85b P26 was found in consequence of an increasing CuSO4 concentration. The viability of OMYsd 1x cells decreased linear until 1.6 mM, increased at a concentration of 2.0 mM and decreased until the highest concentration (8.0 mM) was reached. The NIH-3T3 and RAsd cell cultures showed very a similar effect on decreasing CuSO4 concentrations. In both cases the viability dropped until a concentration of 0.8 mM and remained at this level until the highest concentration was reached (n=3). OMYsd 1x P30 2 NIH-3T3 P59 RAsd 85b P26 1.5 CEsd 8b P25 1 z-value 0.5 0 -0.5 -1 -1.5 -2 -1.5 -1 -0.5 0 0.5 1 1.5 LOG CuSO4 concentration [mM] Fig. S2. Effect of CuSO4•5H2O on the viability of different cell cultures and determination of the EC50 in the MTT Assay. The absorption percentage of different CuSO4•5H2O -concentrations in relation to the untreated control were transformed into z-values and plotted against the common logarithm. Transformed values were used in order to determine the EC50 values. The plot shows linear graphs that were used for the calculation of the EC50. For OMYsd1x an EC50 value of 1.65 mM could be calculated. The values for NIH-3T3 and RAsd85b were much lower. NIH-3T3 had an EC50 of 0.29 mM and RAsd85b of 0.25 mM. The CEsd8b cells had the lowest value with an EC50 of 0.04 mM. PrestoBlue assay For the PrestoBlue® assay copper sulfate concentrations of 0.4 mM showed the lowest absorption of about 66.2 ± 12.3 % for the OMYsd1x cells compared to the control, while RAsd85b cells and NIH3T3 cells had values of 84.2 ± 13.4 % and 87.6 ± 8.4 %, respectively (Supplemental Fig. S2). The CEsd8b were with 76.1 ± 17.0 % in the same range. Absorption strongly decreased down to 28.0 ± 1.6 % for NIH-3T3 cells when adding the next higher concentration of 0.8 mM. At the same concentration, RAsd85b cells and OMYsd1x cells had values of 44.9 ± 3.6 % and 49.1 ± 6.0 % which was also comparable to the human cells which had a value of 45.1 ± 5.6 %. Absorption in fish cell samples further displayed a slight but continuous decrease with a final percentage of 33.3 ± 3.2 % at 8 mM. The absorption values for the NIH-3T3 and RAsd85b decreased further down to about 14 ± 2 % at the maximum concentration of copper sulfate. The CEsd8b cells showed a different behaviour to increased concentrations of CuSO4•5H2O. The absorption compared to the control dropped to 2.4 ± 1.0 % at 1.6 mM and was constant in the range under 5 % for copper sulfate concentrations up to 8 mM. OMYsd 1x P35 percent fluorescence of control 120 NIH-3T3 P44 RAsd 85b P35 100 CEsd 8b P25 80 60 40 20 0 0 1 2 3 4 5 6 7 8 9 CuSO4 concentration [mM] Fig. S3. Effect of copper sulphate (CuSO4) on the viability of different cell cultures and determination of the EC50 in the PrestoBlue Assay. A decreasing mean cell viability of three replicates of the cell cultures OMYsd 1x P30, NIH-3T3 P59 and RAsd 85b P26 was found in consequence of an increasing CuSO4 concentration. The cell viability of OMYsd decreased clear until a concentration of 0.8 mM and decreased with higher concentrations more slowly. The cell viability of NIH-3T3 decreased more intensive until a concentration of 2.0 mM and continued on a constant level until the end concentration (n=3). OMYsd 1x P35 2 NIH-3T3 P44 RAsd 85b P35 1.5 CEsd 8b P25 1 z-value 0.5 0 -0.5 -1 -1.5 -2 -1.5 -1 -0.5 0 0.5 LOG CuSO4 concentration [mM] 1 1.5 Fig. S4. Effect of CuSO4• 5H2O on the viability of different cell cultures and determination of the EC50 in the PrestoBlue® Assay. The absorption percentage of different CuSO4•5H2O -concentrations in relation to the untreated control were transformed into z-values and plotted against the common logarithm. Transformed values were used in order to determine the EC50 values. The plot shows linear graphs that were used for the calculation of the EC50. The EC50 of the four cell cultures were in a similar range. The EC50 for OMYsd1x was 1.33 mM, for NIH-3T3 0.74 mM and for RAsd85b 0.48 mM. CEsd8b cells had an EC50 of 0.56 mM. Fig. S5. Dynamic monitoring of cell impedance of four different cell cultures. OMYsd1x fish skinderived cells, human skin-derived CEsd8b cells, rat skin-derived RAsd85b cells and NIH-3T3 mouse fibroblast cells were measured during 24 hours by real-time cell analysis. All cell lines showed a characteristic impedance pattern (red lines), with highest CI values after 4 hours for the OMYsd1x and RAsd85b cells. After 4 hours, all CIs decreased and showed then plateau phases. The NIH-3T3 cells, however, showed lowest CI values, but an increase after 12 hours until 24 hours. The green line represents the negative control without cells. (all curves n=3). Fig. S6. Microscopic observations of NIH-3T3 cells during a xCELLigence® measurement. Pictures have been taken 2 h (1*), 6 h (2*) and 72 h (3*) after seeding and 6h after addition of copper sulfate (*4) at two different concentrations. After seeding cells were first round, but then started to get flattened before they grew and formed an entire monolayer. After addition of copper sulfate cells shrinked and got round again, presumably loosing cell-cell contacts. At the highest concentration cells shrinked, but did not separate. Scale bars: 100 µm. Tables Table S1. Copper sulfate concentrations by serial dilution. Mass concentration Molar concentration Molecular weight [mg/mL] [mmol/L] CuSO4 5 H2O 2 8 249,69 g/mol 1 4 0,5 2 0,4 1,6 0,2 0,8 0,1 0,4 0,01 0,04 Table S2. Physicochemical parameters of the experimental media used in the experiments. Parameter CEsd 8b RAsd 85b NIH3T3 OMYsd 1x Temperature °C 37 37 37 20 Salinity in ppt <1 <1 <1 <1 CO2 in % 5 5 5 1.9 pH 7.2-7.4 7.2-7.4 7.2-7.4 7.2-7.4 Medium DMEM DMEM DMEM DMEM Glucose 4,5g/L 4,5g/L 4,5g/L 4,5g/L L-Glutamin + + + + FCS Concentration in % 10 10 10 20 Passages (P) used for P24, P25 the toxicity tests P14, P26, P43, P44, P24, P35 P59 P35 P30,
