Text S1. Statistical Analysis: detailed description of the statistical
advertisement
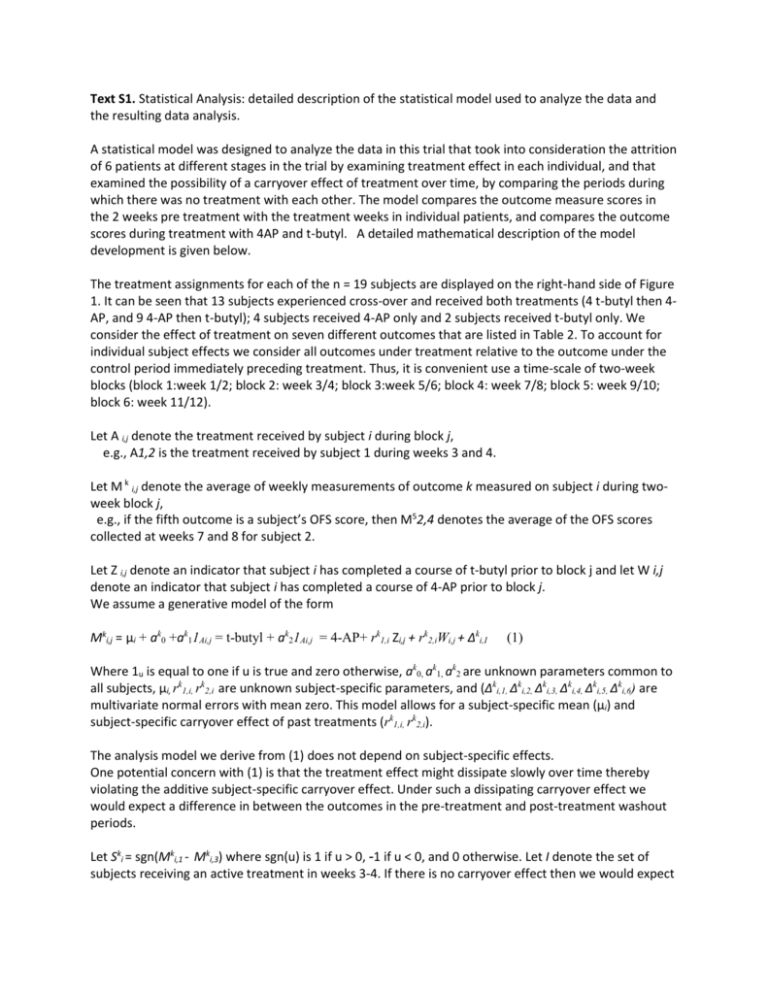
Text S1. Statistical Analysis: detailed description of the statistical model used to analyze the data and
the resulting data analysis.
A statistical model was designed to analyze the data in this trial that took into consideration the attrition
of 6 patients at different stages in the trial by examining treatment effect in each individual, and that
examined the possibility of a carryover effect of treatment over time, by comparing the periods during
which there was no treatment with each other. The model compares the outcome measure scores in
the 2 weeks pre treatment with the treatment weeks in individual patients, and compares the outcome
scores during treatment with 4AP and t-butyl. A detailed mathematical description of the model
development is given below.
The treatment assignments for each of the n = 19 subjects are displayed on the right-hand side of Figure
1. It can be seen that 13 subjects experienced cross-over and received both treatments (4 t-butyl then 4AP, and 9 4-AP then t-butyl); 4 subjects received 4-AP only and 2 subjects received t-butyl only. We
consider the effect of treatment on seven different outcomes that are listed in Table 2. To account for
individual subject effects we consider all outcomes under treatment relative to the outcome under the
control period immediately preceding treatment. Thus, it is convenient use a time-scale of two-week
blocks (block 1:week 1/2; block 2: week 3/4; block 3:week 5/6; block 4: week 7/8; block 5: week 9/10;
block 6: week 11/12).
Let A i,j denote the treatment received by subject i during block j,
e.g., A1,2 is the treatment received by subject 1 during weeks 3 and 4.
Let M k i,j denote the average of weekly measurements of outcome k measured on subject i during twoweek block j,
e.g., if the fifth outcome is a subject’s OFS score, then M52,4 denotes the average of the OFS scores
collected at weeks 7 and 8 for subject 2.
Let Z i,j denote an indicator that subject i has completed a course of t-butyl prior to block j and let W i,j
denote an indicator that subject i has completed a course of 4-AP prior to block j.
We assume a generative model of the form
Mki,j = µi + ak0 +ak11Ai,j = t-butyl + ak21Ai,j = 4-AP+ rk1,i Zi,j + rk2,iWi,j + ∆ki,I
(1)
Where 1u is equal to one if u is true and zero otherwise, ak0, ak1, ak2 are unknown parameters common to
all subjects, µi, rk1,i, rk2,i are unknown subject-specific parameters, and (∆ki,1, ∆ki,2, ∆ki,3, ∆ki,4, ∆ki,5, ∆ki,6) are
multivariate normal errors with mean zero. This model allows for a subject-specific mean (µi) and
subject-specific carryover effect of past treatments (rk1,i, rk2,i).
The analysis model we derive from (1) does not depend on subject-specific effects.
One potential concern with (1) is that the treatment effect might dissipate slowly over time thereby
violating the additive subject-specific carryover effect. Under such a dissipating carryover effect we
would expect a difference in between the outcomes in the pre-treatment and post-treatment washout
periods.
Let Ski = sgn(Mki,1 - Mki,3) where sgn(u) is 1 if u > 0, -1 if u < 0, and 0 otherwise. Let I denote the set of
subjects receiving an active treatment in weeks 3-4. If there is no carryover effect then we would expect
an equal number of 1's and -1's in the set {Ski , i ∈ I }. Formally, we assume {Ski , i ∈ I } are independent
and identically distributed and we test the null hypothesis H0 : P(Sk1 =1) = P(Sk1 = -1) for each outcome k
using a Χ2 test. Below table shows the test statistics and corresponding p-values; there is no evidence of
a carryover effect in any of the outcomes under consideration.
p-values
Χ2
OFS
1.8
0.18
SS+
0.09
0.76
RI+
0.11
0.74
Tail function DNI
0.0
1.0
Bladder function DNI
0.0
1.0
Hindlimb function without support DNI
0.14
0.71
Hindlimb function with support DNI
1.3
0.26
Table legend: Chi-square test comparing outcomes in weeks 1-2 with outcomes in weeks 5-6 using data
from subjects receiving active treatment in weeks 3-4. Note *OFS: open field score; SS+:stepping score
with support; RI+: regularity index with support; DNI: owners’ questionnaire score
Outcome
For each (I, j, k) triple such that Ai,j is either t-butyl or 4-AP, and outcome k is measured on subject i in
blocks j and j -1, define Y ki,j = Mki,j – Mki,j-1. Model (1) implies
Yki,j = ßk0 +ßk1 Ai,j +eki,j (2)
where ßk0 , ßk1 are unknown parameters, eki,j are mean zero normal errors that are assumed to be
independent across subjects and satisfy Var(eki,j) = ∆2k and Cov (eki,j , eki,l )= tk if l ≠ j. We code Ai,j to take
values in {-1, 1} with 1 denoting 4-AP and -1 denoting t-butyl; with this coding ßk0 represents the main
effect of treatment relative to placebo and ßk1 represents the relative difference between 4-AP and tbutyl.
Let J i denote the blocks in which subject i received either 4-AP or t-butyl. The data used to estimate the
parameters in (2) are {(Yki,j, Ai,j),j ∈ J i , i=1, …,n) ; thus, subjects that complete one course of active
treatment contribute one observation to the data and subjects completing two courses of active
treatment contribute two observations. Any unique characteristics of patients dropping out of the study
are assumed to be captured in the subject-specific mean and carry-over effects in (1). We estimate the
parameters ßk0 and ßk1 using maximum likelihood. The estimated parameters are given in Table below.
Outcome
ß k0
(p-values)
ß k1
(p-values) Ave. Imp.
OFS
0.62
(0.005)
0.15
(0.31)
0.66
SS+
13.6
(<0.0001)
1.9
(0.51)
13.4
RI+
4.7
(0.028)
2.2
(0.13)
4.9
Tail function DNI
0.055
(0.29)
-0.002
(0.94)
0.063
Bladder function DNI
0.059
(0.18)
0.059
(0.18)
0.063
Hindlimb function
0.25
(0.076)
0.061
(0.54)
0.27
without support DNI
Hindlimb function
0.17
(0.035)
0.17
(0.13)
0.17
with support DNI
Table legend: Estimated coefficients ßk0, ßk1 for each of the outcome; treatments are coded to take
values in {-1, 1} with 4-AP coded as 1 and t-butyl as -1. Four of the seven outcomes show significant
main effects (ßk0 ) at the 0.05 level (not adjusted for multiplicity). There was no significant difference
between t-butyl and 4-AP (ßk1) at the 0.05 level in any of the outcomes under consideration. The last
column shows the average improvement over placebo computed as the average of Yki,j over all (i, j) for
which Yki,j is defined.
The main effect of treatment was significant at the 0.05 level for four of the seven outcomes under
consideration; adjusting for multiplicity via the Bonferroni correction a 0.05 significance level becomes
0.05/7 = 0.007 at which the main effect of treatment was significant in two of the seven outcomes.
There was no significant difference between 4-AP and t-butyl at the 0.05 level for any of the outcomes.

