Lab-5-Atmospheric
advertisement
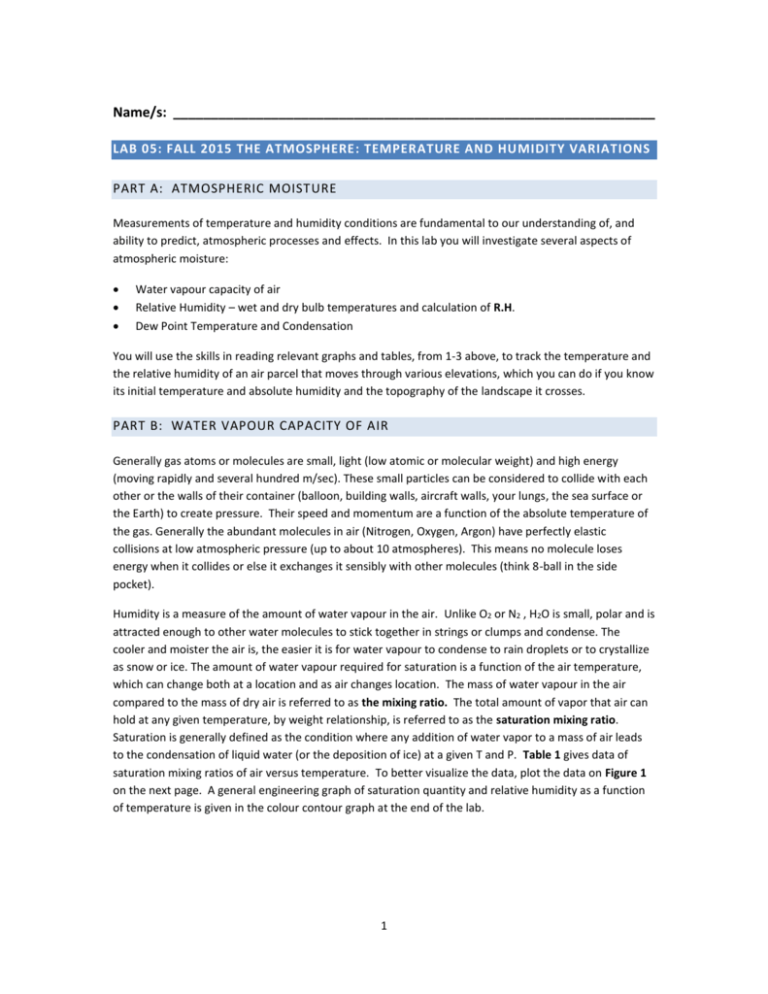
Name/s: ________________________________________________________________ LAB 05: FALL 2015 THE ATMOSPHERE: TEMPERATURE AND HUMIDITY VARIATIONS PART A: ATMOSPHERIC MOISTURE Measurements of temperature and humidity conditions are fundamental to our understanding of, and ability to predict, atmospheric processes and effects. In this lab you will investigate several aspects of atmospheric moisture: Water vapour capacity of air Relative Humidity – wet and dry bulb temperatures and calculation of R.H. Dew Point Temperature and Condensation You will use the skills in reading relevant graphs and tables, from 1-3 above, to track the temperature and the relative humidity of an air parcel that moves through various elevations, which you can do if you know its initial temperature and absolute humidity and the topography of the landscape it crosses. PART B: WATER VAPOUR CAPACITY OF AIR Generally gas atoms or molecules are small, light (low atomic or molecular weight) and high energy (moving rapidly and several hundred m/sec). These small particles can be considered to collide with each other or the walls of their container (balloon, building walls, aircraft walls, your lungs, the sea surface or the Earth) to create pressure. Their speed and momentum are a function of the absolute temperature of the gas. Generally the abundant molecules in air (Nitrogen, Oxygen, Argon) have perfectly elastic collisions at low atmospheric pressure (up to about 10 atmospheres). This means no molecule loses energy when it collides or else it exchanges it sensibly with other molecules (think 8-ball in the side pocket). Humidity is a measure of the amount of water vapour in the air. Unlike O2 or N2 , H2O is small, polar and is attracted enough to other water molecules to stick together in strings or clumps and condense. The cooler and moister the air is, the easier it is for water vapour to condense to rain droplets or to crystallize as snow or ice. The amount of water vapour required for saturation is a function of the air temperature, which can change both at a location and as air changes location. The mass of water vapour in the air compared to the mass of dry air is referred to as the mixing ratio. The total amount of vapor that air can hold at any given temperature, by weight relationship, is referred to as the saturation mixing ratio. Saturation is generally defined as the condition where any addition of water vapor to a mass of air leads to the condensation of liquid water (or the deposition of ice) at a given T and P. Table 1 gives data of saturation mixing ratios of air versus temperature. To better visualize the data, plot the data on Figure 1 on the next page. A general engineering graph of saturation quantity and relative humidity as a function of temperature is given in the colour contour graph at the end of the lab. 1 Graphing Exercise (6) Figure 1 Table 1: Saturation mixing ratio (at 1000 mb). Temperature Degrees Celsius Vapor (g) per Kilogram of Dry Air 50 88.12 40 49.81 30 27.69 20 14.85 10 7.76 0 3.84 0 10 Temperature 2 20 30 40 50 Use the data from Table 1 or your graph to find the water vapour content at saturation for 1kg of air at the following temperatures : (2 points each, 6 points) 0oC: _________g/kg 25oC : _______g/kg -10oC:________g/kg Another useful measurement is the quantity of water in air at saturation (Saturation Quantity). Use Figure 2 to give the saturation quantity (grams per cubic meter) for a mass of air having a temperature of: (2 ea, 10 points) 35°C __________g/m3 25°C __________g/m3 20°C __________g/m3 0°C __________g/m3 -10°C _________ g/m3 3 Figure 2: Saturation Quantity and Dew Point Chart PART C: RELATIVE HUMIDITY The most commonly used measure of humidity is relative humidity. It can be simply defined as the amount of water in the air relative to the saturation amount the air can hold at a given temperature multiplied by 100. For example, air with a relative humidity of 50% contains half the water vapor it could hold at saturation at any particular temperature. The relative humidity can be found by using a psychrometer (two thermometers) and a chart. One of the thermometers measures the air temperature. This is the dry-bulb reading. The other thermometer has a wet wick on the bottom of the bulb. Water evaporating from the wick into the air takes energy with it, cooling off the thermometer. As the relative humidity increases, less water can evaporate into the air. This makes the temperature readings between the two therm ometers closer. The difference between the wet and dry-bulb temperatures is called the wet-bulb depression. The wet-bulb temperature is always lower than or the same as the dry -bulb temperature. If the temperatures are the same, the relative humidity is 100 percent. The wet-bulb depression is used with the dry-bulb temperature and a chart to determine the relative humidity. Table 2 shows this chart. 4 TABLE 2 Chart for Determining Relative Humidity (%) Use Table 2 to find the relative humidity for each of the pairs of psychrometer readings: Reading 1 Reading 2 (2 ea., 6 points) Reading 3 Dry bulb temperature 20oC 32oC -4 oC Wet bulb temperature 18oC 25oC -8 oC Difference ______ ______ _______ R. H. ______% ______% _______% What do you notice about the range in relative humidities at very low temperatures versus at higher temperatures? (2 points) PART C: DEW POINT AND CONDENSATION 5 The temperature at which water vapor condenses into liquid water is called the dew point. If the dew point is below 0°C, it is called the frost point. These are important numbers in helping to determine where to post frost warnings. The dew-point temperature is found in a similar manner to that of relative humidity. The dry-bulb and wet-bulb temperatures are determined. The wet-bulb depression and dry-bulb temperature are used with the chart in Table 3 to find the dew point. There are a number of on-line dew point calculators and graphical versions of psychrometric charts. These are used by meteorologists, HVAC Engineers, the paint industry (days to mold for dampened painted surfaces) etc. You too can make use of this to decide whether your cheese will dry out or your crackers go limp (crunch is an important basic food group). Also you can figure out whether to hang out your laundry to dry! DRY BULB TEMPERATURE - T D B The Dry Bulb temperature, usually referred to as air temperature, is the air property that is most common used. When people refer to the temperature of the air, they are normally referring to its dry bulb temperature. The Dry Bulb Temperature refers basically to the ambient air temperature. It is called "Dry Bulb" because the airtemperature is indicated by a thermometer not affected by the moisture of the air. Dry-bulb temperature - Tdb, can be measured using a normal thermometer freely exposed to the air but shielded from radiation and moisture. The temperature is usually given in degrees Celsius (oC) or degrees Fahrenheit (oF). The SI unit is Kelvin (K). Zero Kelvin equals to -273oC. The dry-bulb temperature is an indicator of heat content and is shown along the bottom axis of the psychrometric chart. Constant dry bulb temperatures appear as vertical lines in the psychrometric chart. WET BULB TEMPERATURE - T W B The Wet Bulb temperature is the temperature of adiabatic saturation. This is the temperature indicated by a moistened thermometer bulb exposed to the air flow. Wet Bulb temperature can be measured by using a thermometer with the bulb wrapped in wet muslin. The adiabatic evaporation of water from the thermometer and the cooling effect is indicated by a "wet bulb temperature" lower than the "dry bulb temperature" in the air. The rate of evaporation from the wet bandage on the bulb, and the temperature difference between the dry bulb and wet bulb, depends on the humidity of the air. The evaporation is reduced when the air contains more water vapor. 6 The wet bulb temperature is always lower than the dry bulb temperature but will be identical with 100% relative humidity (the air is at the saturation line). Combining the dry bulb and wet bulb temperature in a psychrometric diagram or Mollier chart, gives the state of the humid air. Lines of constant wet bulb temperatures run diagonally from the upper left to the lower right in thePsychrometric Chart. DEW POINT TEMPERATURE - T D P The Dew Point is the temperature at which water vapor starts to condense out of the air (the temperature at which air becomes completely saturated). Above this temperature the moisture will stay in the air. if the dew-point temperature is close to the dry air temperature - the relative humidity is high if the dew point is well below the dry air temperature - the relative humidity is low If moisture condenses on a cold bottle taken from the refrigerator, the dew-point temperature of the air is above the temperature in the refrigerator. The Dew Point temperature can be measured by filling a metal can with water and some ice cubes. Stir by a thermometer and watch the outside of the can. When the vapor in the air starts to condensate on the outside of the can, the temperature on the thermometer is pretty close to the dew point of the actual air. The Dew Point is given by the saturation line in the psychrometric chart. DEW POINT TEMPERATURE CHARTS Dew point temperatures from dry and wet bulb temperatures are indicated in the charts below. Use Table 3 to determine the dew point temperature for each of the following pairs of psychrometer readings: (2 points each) Reading 1 Reading 2 Reading 3 Dry bulb temperature 8oC 30oC -4oC Wet bulb temperature 6oC 24oC -8oC Difference ______ ______ _______ Dew point temperature ______ oC ______ oC _______ oC 7 TABLE 3 Chart for Determining Dew-point Temperature (°C) Note without colour the 0° wet bulb curve is lower left and the 40°C curve is upper right. Use Table 3 to determine the dew point temperature for each of the following pairs of psychrometer readings: (3 points each) 8 Reading 1 Reading 2 Reading 3 Dry bulb temperature 8oC 30oC -4oC Wet bulb temperature 6oC 24oC -8oC Difference ______ ______ _______ Dew point temperature ______ oC ______ oC _______ oC PART E: REAL WORLD APPLICATION In the real world, air parcels have properties, such as temperature, pressure and humidity, which are measurable at a given place and time. As the air parcel moves, horizontally and vertically, these properties will change with the environment. When air rises and experiences a decrease in pressure, it expands and cools, whereas descending air is compressed and its temperature rises. Such temperature changes caused by expansion or compression are called adiabatic temperature changes. Air with a temperature above its dew point (unsaturated air) warms or cools at the dry adiabatic rate of 10oC per 1000m. Rising saturated air cools at the wet adiabatic rate with an average of about 5oC per 1000m. This exercise will require the methods developed above to work out what will happen to an air mass as it crosses a mountain and valley system, such as happens in a westerly air flow from the BC coast toward the Interior. PROCEDURE You are given the initial conditions of absolute humidity (mass of water vapor, in grams, per unit volume of dry air, in cubic meters) and temperature (see exercise below). Knowing these facts about the air mass, you will work out the maximum amount of water vapor (the saturation quantity) it could potentially hold at the start of the cross-section (from knowing its temperature and then consulting Figure 2). Once you know the saturation quantity, you can compare the actual absolute humidity with this maximum, in order to calculate its relative humidity at the beginning. Knowing its actual absolute humidity, you can work out its dew point temperature, again by consulting Figure 2. Once you know its initial dew point temperature, you can then determine its saturation condensation level (SCL or dew point elevation). You do this by subtracting the dew point temperature from the starting temperature and then dividing your answer by the dry adiabatic lapse rate. 9 Once you know the SCL, you know that the air will cool at the dry adiabatic lapse rate up until that elevation and then will switch to the wet adiabatic lapse rate above that elevation (as long as the air is rising: descending air always warms at the dry rate). You will then be able to determine the temperature at the highest point: Subtract the SCL from the highest elevation Multiply that answer by the wet adiabatic lapse rate Then subtract that answer from the dew point temperature. Work out the absolute humidity for the highest elevation. Remember that the actual absolute humidity cannot be greater than the saturation quantity for the coldest temperature (the temperature that can hold the least water vapor). You can calculate the temperature at the end by: multiplying the kilometers of descent times the dry rate and then adding the answer to the cold temperature at the top of the tallest peak. Look up the saturation quantity for the temperature at the end. Since you know the absolute humidity left in the air after its ascent to the highest point in the cross-section and since you also know the saturation quantity at the end of the cross section, you are now in a position to calculate the relative humidity at the end. A useful formula for relative humidity is RH = AH x 100/S, where: RH = Relative humidity (what you're trying to find) AH = Absolute humidity (what you're given at A or what's left over in the air mass at D) S = Saturation quantity for air at a particular temperature (here, at E) In the last section, summarize why there is such a difference in temperature and relative humidity from the beginning to the end. Think about what latent heat is and what it has to do with water's phase changes. STARTING CONDITIONS A mass of air has an initial temperature of 35°C and an absolute humidity of 9 g/m 3. It blows over a terrain having the cross section shown in Figure 3. QUESTIONS 1. What is its relative humidity at the beginning of its ascent? __________ % Show your calculation: (5) 2. What is the dew point for this parcel of air? __________°C 10 (2) 3. At which elevation will the air reach dew point? In other words, what is the saturation condensation level? __________ km Show your calculation: (5) 4. Will it rain on slope A-B? _____yes _____no Explain: (3) 5. Will it rain on slope B-C? _____yes _____no Explain: 6. Will it rain on slope C-D? _____yes _____no Explain: (3) 7. Will it rain on slope D-E? _____yes _____no Explain: (3) 8. What will the temperature be at the highest point in the cross-section? __________°C Show your calculation: (5) 9. What is the new dew point and the new absolute humidity for this air? (3) (4) __________°C and __________g/m3 10. Why does there have to be a new dew point and absolute humidity? (2) 11. What will the temperature be at E? __________°C Show your calculation: (5) 12. What will the relative humidity be at E? __________% Show your calculation: (5) 11 13. Why is the temperature so much greater at E than it was when it started out at A? (2) 14. Why is the relative humidity at E so much lower than at A despite being at sea level? (2) 15. How does this exercise relate to Continentality and what Continents do to passing weather systems? (4) 16. How high would a third mountain range to the right of E have to be to experience any precipitation from this particular air mass? (4) 12 13

