Honors Geometry
advertisement
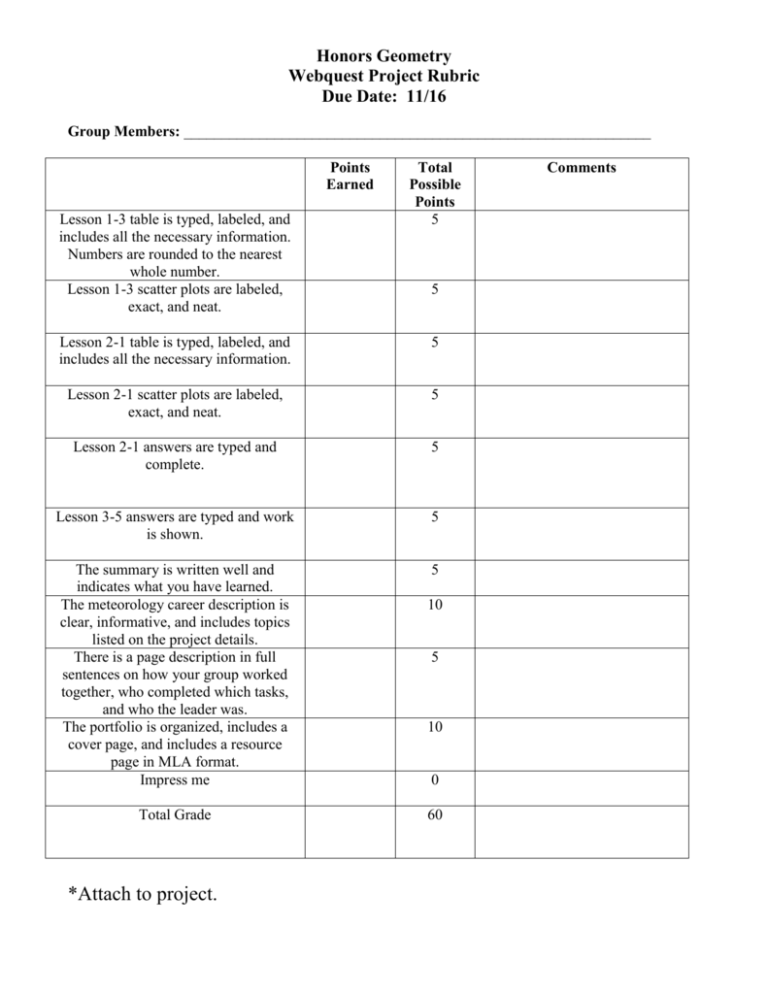
Honors Geometry Webquest Project Rubric Due Date: 11/16 Group Members: ______________________________________________________________ Points Earned Lesson 1-3 table is typed, labeled, and includes all the necessary information. Numbers are rounded to the nearest whole number. Lesson 1-3 scatter plots are labeled, exact, and neat. Total Possible Points 5 5 Lesson 2-1 table is typed, labeled, and includes all the necessary information. 5 Lesson 2-1 scatter plots are labeled, exact, and neat. 5 Lesson 2-1 answers are typed and complete. 5 Lesson 3-5 answers are typed and work is shown. 5 The summary is written well and indicates what you have learned. The meteorology career description is clear, informative, and includes topics listed on the project details. There is a page description in full sentences on how your group worked together, who completed which tasks, and who the leader was. The portfolio is organized, includes a cover page, and includes a resource page in MLA format. Impress me 5 Total Grade *Attach to project. 10 5 10 0 60 Comments Honors Geometry Webquest When is Weather Normal? Objective: Research relationships between latitude, longitude and average monthly temperature. Task: Go to the website, www.geometryonline.com -> Webquest Project -> Unit 1 to answer the questions in lesson 1-3, 2-1, and 3-5. Lesson 1–3 Bonnie has decided to use the five pairs of cities shown in the table below for her research. She chose to use the average high temperature for July to make her comparisons. The latitude and longitude have been rounded to the nearest degree. Latitude Longitude Anchorage, AK Fresno, CA 61 N 37 N 150 W 120 W July High Temperature 58 82 Washington, DC Salt Lake City, UT 39 N 41 N 77 W 112 W 76 78 Tampa, FL Minneapolis, MN 28 N 45 N 82 W 93 W 82 74 Oklahoma City, OK Bismarck, ND 35 N 47 N 98 W 101 W 82 71 Spokane, WA San Antonio, TX 48 N 29 N 117 W 98 W 69 85 City Degree Distance (Source: World Almanac) 1. Recreate the table and fill in the Degree Distance column using the following directions. For each pair of cities, write an ordered pair (x, y) for each city such that x is the latitude and y is the longitude. Use the Distance Formula to find the degree distance for each pair of cities using the ordered pairs. (A pair of cities has only one degree distance.) The resulting value will be the distance between cities relative to the degrees of latitude and longitude. 2. Make a scatter plot comparing degree distance and temperature. For each pair of cities write the ordered pair (degree distance, |difference in temperature|). Plot the five ordered pairs and look for a relationship. 3. Make a second scatter plot comparing latitude and temperature. For each pair of cities write the ordered pair (|difference in latitude|, |difference in temperature|). Plot the five ordered pairs and look for a relationship. 4. Make a third scatter plot comparing longitude and temperature. For each pair of cities write the ordered pair (|difference in longitude|, |difference in temperature|). Plot the five ordered pairs and look for a relationship. Lesson 2–1 Refer to the three scatter plots you made in Lesson 1-3. 1. Make a conjecture about the relationship shown by each scatter plot. 2. Find the five pairs of cities you will use for your project. Make a table and three scatter plots for your chosen cities. Compare your scatter plots to those you made in Lesson 1–3. 3. Do the conjectures you made in Exercise 1 hold for the scatter plots you made in Exercise 2? Explain. Lesson 3–5 A degree of latitude or longitude measures about 69 miles at the equator. The land distance between degrees of longitude gradually reduces until it is 0 at the poles. The distance between degrees of latitude varies slightly as you move away from the equator but is still about 69 miles at the poles. (Source: World Almanac) 1. The ordered pair (latitude, longitude) for Washington, D.C., is (39, 77) and for Los Angeles, California, is (34,118). Find the degree distance for the two cities to the nearest tenth of a degree. 2. Find the distance to the nearest tenth of a mile between the two cities using the degree distance. Since these cities are not located at the pole, assume that a degree of latitude or longitude measures 69 miles. 3. Find the actual air distance between the two cities. Compare it to the distance you found in Exercise 1. 4. Compare the distance between other pairs of cities using the degree distance measure and the actual distance. What seems to be the relationship? In addition to answering the questions, 1. ______ Write up to one page summary of your project. Be sure to indicate what the group has learned. 2. ______ Research a career in meteorology. Write a one page description about this type of career. Include topics such as the nature of the work, the training needed (education), possible employment locations, working conditions, and salary potential. 3. ______ Include a page which describes how your group worked together. Who completed which tasks? Who was your leader? 4. ______ Create a resource page. Cite all sources (including internet sources) using the MLA format. Organize all the information into a portfolio or another method I approve. The project is worth 60 points. Turn in by Friday, November 16th. No late projects will be accepted.


