teacher_instructions
advertisement
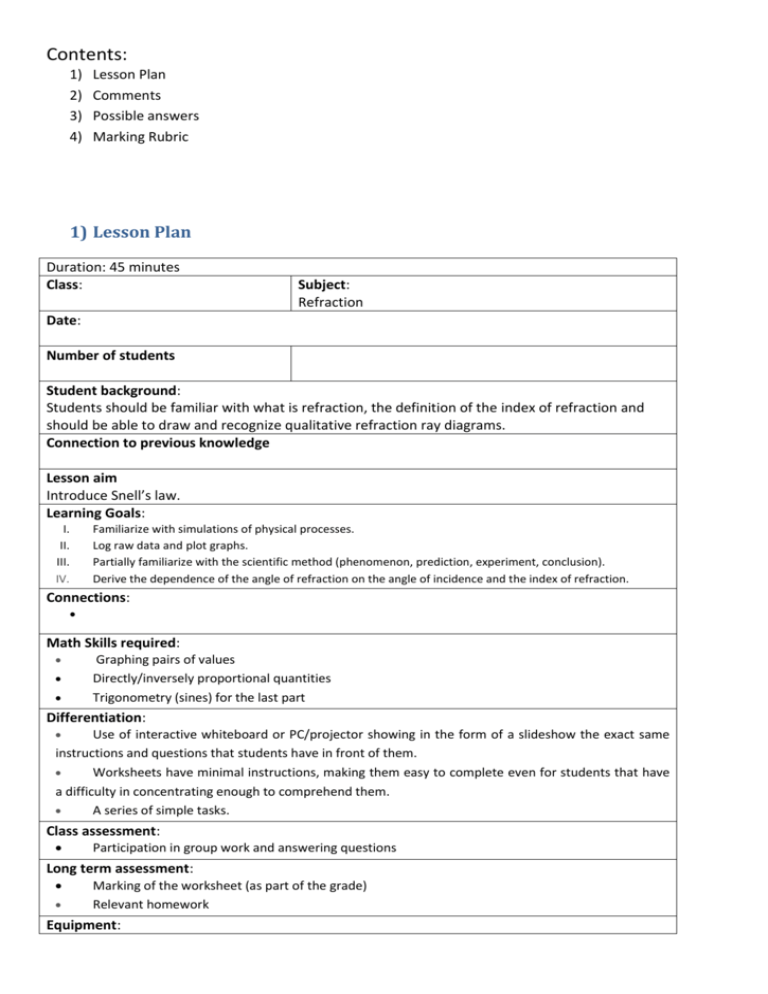
Contents: 1) 2) 3) 4) Lesson Plan Comments Possible answers Marking Rubric 1) Lesson Plan Duration: 45 minutes Class: Subject: Refraction Date: Number of students Student background: Students should be familiar with what is refraction, the definition of the index of refraction and should be able to draw and recognize qualitative refraction ray diagrams. Connection to previous knowledge Lesson aim Introduce Snell’s law. Learning Goals: I. II. III. IV. Familiarize with simulations of physical processes. Log raw data and plot graphs. Partially familiarize with the scientific method (phenomenon, prediction, experiment, conclusion). Derive the dependence of the angle of refraction on the angle of incidence and the index of refraction. Connections: Math Skills required: Graphing pairs of values Directly/inversely proportional quantities Trigonometry (sines) for the last part Differentiation: Use of interactive whiteboard or PC/projector showing in the form of a slideshow the exact same instructions and questions that students have in front of them. Worksheets have minimal instructions, making them easy to complete even for students that have a difficulty in concentrating enough to comprehend them. A series of simple tasks. Class assessment: Participation in group work and answering questions Long term assessment: Marking of the worksheet (as part of the grade) Relevant homework Equipment: PC with office suite connected to a projector or interactive whiteboard Slideshow presentation Copies of the worksheet (preferably one for each student) One PC for each group, running the PhET simulation “Refraction of Light” Each PC should have an office suite installed and a copy of the “lab_refraction.xlsx” file Lesson Teacher Describes the activity – makes sure each group is setup correctly Guides the discussion and writes the group answers on the interactive whiteboard Students time Ask initial questions 5’ □ Complete the theory part 5’ Discuss the theory part in groups 5’ □ □ Conduct experiment 1 10’ Conduct experiment 2 10’ Write the conclusion 5’ Discussion of the conclusion in groups 5’ □ □ □ □ Homework: Problem Worksheet 2) Comments: The suggested activity should be done after introducing refraction qualitatively and before introducing Snell’s law. It can be done in groups working independently on the simulation, or by the teacher working on her/his PC and presenting to the class through the projector/interactive whiteboard. In parts of the activity where sharing takes place, the teacher can annotate on the slideshow (using the interactive whiteboard’s pen). The accompanying “lab_refraction.xlsx” file can be used by the students to get a quick feel of the graph, but it is better that they actually draw by hand the graph on the worksheet. 3) Possible Answers Theory / Definitions 1. Optical (or transparent) medium: A medium that allows the passage of light through it, like glass. (Or similar, depending on the textbook) 2. Index of refraction: The ratio of the speed of light in vacuum over the speed of light in the transparent medium. It is greater than 1 (or equal to 1 for vacuum and, approximately, for air). (Or similar, depending on the textbook) 3. Refraction: The change of direction of a wave (or ray) as it changes medium, passing from one to the other at an angle. It is connected to the change of the speed of the wave. (Or similar, depending on the textbook) 4. Denote the angles of incidence 𝑖 and refraction 𝑟. 𝒊 𝒓 Experiment 1: Dependence of angle of refraction on the angle of incidence Laser light falls from air to a transparent medium. Prediction: What do we expect to happen to the angle of refraction as the index of refraction of the transparent medium increases? Explain. Students will usually write something like “increase” or “decrease”. A good explanation can suggest that since the index of refraction is increasing, the whole phenomenon becomes more pronounced and the ray will bend more. Table 1: Angle of reflaction vs the index of refraction (typical values) Measurement Index of refraction 𝑛 Angle of refraction (degrees) 1 2 3 4 5 6 7 1,00 1,10 1,20 1,30 1,40 1,50 1,60 50 45 40 36 33 31 29 Note: The thickness of the ray makes the angle of refraction uncertain by ±1𝑜 60 Sample graph 1 Angle of refraction (degrees) 50 40 30 20 10 0 1 1.1 1.2 1.3 1.4 1.5 1.6 1.7 Index of refraction n Conclusion compared to our prediction: Depends on the prediction, but the shape of the graph should be discussed. Experiment 2: Dependence of the angle of refraction on the angle of incidence Predictions/Hypothesis: What do we expect to happen to the angle of refraction as the angle of incidence increases? Explain. Table 2: Angle of refraction vs angle of incidence (typical values) Measurement Angle of Angle of incidence refraction (degrees) (degrees) 1 2 3 4 5 6 7 8 10 20 30 40 50 60 70 80 9 15 22 30 35 40 45 48 Note: The thickness of the ray makes the angle of refraction uncertain by ±1𝑜 60 Sample graph 2 Angle of refraction (degrees) 50 40 30 20 10 0 0 10 20 30 40 50 60 70 80 90 Angle of incidence (degrees) Conclusion compared to the prediction: Depends on the prediction, but the shape of the graph should be discussed. Conclusion: Theory predictions versus the results of the 2 experiments. A number of scientists between the 10th and the 17th centuries (Sahl, Snellius, Descartes) concluded that the following formula should relate the angle of incidence 𝑖 with the angle of refraction 𝑟: 𝑠𝑖𝑛𝑟 𝑠𝑖𝑛𝑖 = 𝑛 Explain if the results of the 2 simulated experiments above are compatible with the formula. Experiment 1: Most students will notice that 𝑠𝑖𝑛𝑖 is inversely proportional to the index of refraction. Students more mathematically inclined will also note that the sine function is monotonically increasing. Experiment 2: Most students will notice that 𝑠𝑖𝑛𝑖 is proportional to 𝑠𝑖𝑛𝑟. Students more mathematically inclined will also note that the sine function is monotonically increasing. 4) Marking Rubric Participation Data Collection Data Processing Conclusion/Discussion 3 Follows all instructions. Maintains all safety rules. Completes all parts of the worksheet. 2 Needs a lot of help to understand what is to be done. Maintains all safety rules. Completes all parts of the worksheet. All data is entered neatly in the tables, with care for digits and decimals. The data is correct. The graphs are neatly drawn, including axis labels, correct scales, correct positioning of the points and correctly drawn best fit line. Actively participates in the discussion within the group and in the class. The conclusion of each experiment is written clearly and connected to the prediction. The last part shows understanding of the whole activity. All data is entered neatly in the tables. The data is correct. Total= 0-1 Can’t continue with the work without a lot of encouragement. Is not serious about safety. Doesn’t complete all parts of the worksheet. Some data is entered in the tables. The graphs are with correct scales and, in general, correct positioning of the points and include a best fit line. The graphs show little or no effort and have significant flaws. The conclusion of each experiment is written and it is connected to the prediction. The last part shows some understanding of the whole activity. Some things are written in the conclusion and the last part, but they are trivial and/or wrong. + + 12 + 100 = %
