Feedback Sheet
advertisement
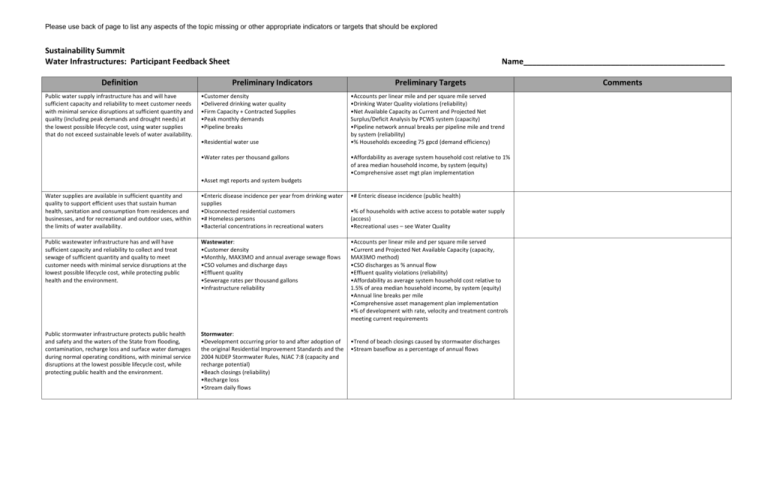
Please use back of page to list any aspects of the topic missing or other appropriate indicators or targets that should be explored Sustainability Summit Water Infrastructures: Participant Feedback Sheet Definition Public water supply infrastructure has and will have sufficient capacity and reliability to meet customer needs with minimal service disruptions at sufficient quantity and quality (including peak demands and drought needs) at the lowest possible lifecycle cost, using water supplies that do not exceed sustainable levels of water availability. Name______________________________________________ Preliminary Indicators •Customer density •Delivered drinking water quality •Firm Capacity + Contracted Supplies •Peak monthly demands •Pipeline breaks •Residential water use •Water rates per thousand gallons Preliminary Targets •Accounts per linear mile and per square mile served •Drinking Water Quality violations (reliability) •Net Available Capacity as Current and Projected Net Surplus/Deficit Analysis by PCWS system (capacity) •Pipeline network annual breaks per pipeline mile and trend by system (reliability) •% Households exceeding 75 gpcd (demand efficiency) •Affordability as average system household cost relative to 1% of area median household income, by system (equity) •Comprehensive asset mgt plan implementation •Asset mgt reports and system budgets Water supplies are available in sufficient quantity and quality to support efficient uses that sustain human health, sanitation and consumption from residences and businesses, and for recreational and outdoor uses, within the limits of water availability. •Enteric disease incidence per year from drinking water supplies •Disconnected residential customers •# Homeless persons •Bacterial concentrations in recreational waters •# Enteric disease incidence (public health) Public wastewater infrastructure has and will have sufficient capacity and reliability to collect and treat sewage of sufficient quantity and quality to meet customer needs with minimal service disruptions at the lowest possible lifecycle cost, while protecting public health and the environment. Wastewater: •Customer density •Monthly, MAX3MO and annual average sewage flows •CSO volumes and discharge days •Effluent quality •Sewerage rates per thousand gallons •Infrastructure reliability •Accounts per linear mile and per square mile served •Current and Projected Net Available Capacity (capacity, MAX3MO method) •CSO discharges as % annual flow •Effluent quality violations (reliability) •Affordability as average system household cost relative to 1.5% of area median household income, by system (equity) •Annual line breaks per mile •Comprehensive asset management plan implementation •% of development with rate, velocity and treatment controls meeting current requirements Public stormwater infrastructure protects public health and safety and the waters of the State from flooding, contamination, recharge loss and surface water damages during normal operating conditions, with minimal service disruptions at the lowest possible lifecycle cost, while protecting public health and the environment. Stormwater: •Development occurring prior to and after adoption of the original Residential Improvement Standards and the 2004 NJDEP Stormwater Rules, NJAC 7:8 (capacity and recharge potential) •Beach closings (reliability) •Recharge loss •Stream daily flows •% of households with active access to potable water supply (access) •Recreational uses – see Water Quality •Trend of beach closings caused by stormwater discharges •Stream baseflow as a percentage of annual flows Comments

