PAA-capped GdF 3 nanoplates as dual MRI and CT contrast agents
advertisement
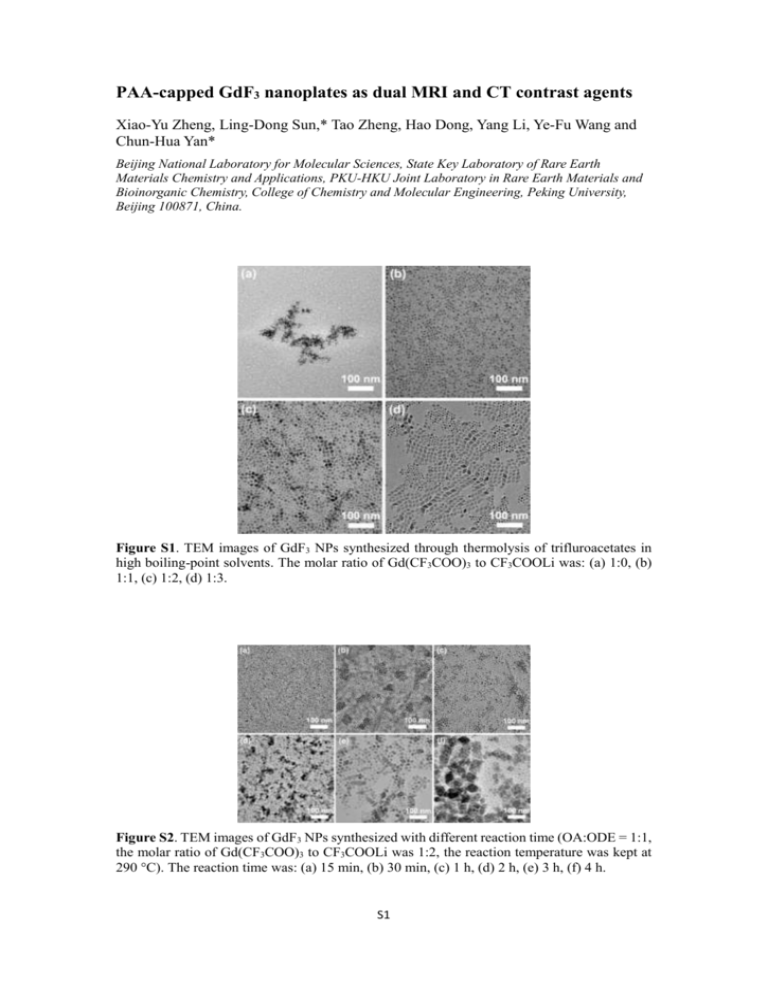
PAA-capped GdF3 nanoplates as dual MRI and CT contrast agents Xiao-Yu Zheng, Ling-Dong Sun,* Tao Zheng, Hao Dong, Yang Li, Ye-Fu Wang and Chun-Hua Yan* Beijing National Laboratory for Molecular Sciences, State Key Laboratory of Rare Earth Materials Chemistry and Applications, PKU-HKU Joint Laboratory in Rare Earth Materials and Bioinorganic Chemistry, College of Chemistry and Molecular Engineering, Peking University, Beijing 100871, China. Figure S1. TEM images of GdF3 NPs synthesized through thermolysis of trifluroacetates in high boiling-point solvents. The molar ratio of Gd(CF3COO)3 to CF3COOLi was: (a) 1:0, (b) 1:1, (c) 1:2, (d) 1:3. Figure S2. TEM images of GdF3 NPs synthesized with different reaction time (OA:ODE = 1:1, the molar ratio of Gd(CF3COO)3 to CF3COOLi was 1:2, the reaction temperature was kept at 290 °C). The reaction time was: (a) 15 min, (b) 30 min, (c) 1 h, (d) 2 h, (e) 3 h, (f) 4 h. S1 Figure S3. TEM images of GdF3 NPs synthesized with different reaction temperature (OA:ODE = 1:1, the molar ratio of Gd(CF3COO)3 to CF3COOLi was 1:2, the reaction time was 30 min). The reaction temperature was kept at: (a) 290 °C, (b) 310 °C. Figure S4. UC emission spectra of (a) OA-capped (13 mg/mL of Gd), (b) citric acid-capped and PAA-capped GdF3:Yb,Er NPs (15.7 μg/mL of Gd) under 980 nm excitation. The inset in (a) is the luminescence photograph of OA-capped NPs dispersed in cyclohexane. As shown in Figure S4, the spectra shows five characteristic emission peaks of Er3+ in the range from 350 nm to 900 nm, including: 410 nm (2H9/2 → 4I15/2), 520 nm (2H11/2 → 4I15/2), 540 nm (4S3/2 → 4I15/2), 655 nm (4F9/2 → 4I15/2) and 826 nm (4I9/2 → 4I15/2). The upconversion emission spectra profile were similar for citric acid-capped and PAA-capped NPs, but the intensity of PAA-capped NPs was slightly higher. S2 Figure S5. Size analysis of GdF3 NPs (long diagonal). Figure S6. Size analysis of GdF3 NPs (short diagonal). Figure S7. Size analysis of GdF3 NPs (thickness). S3 Figure S8. TEM images of GdF3 NPs after ligand-exchange process. (a) NOBF4-PAA route, citric acid route: (b) pH = 2, (c) pH = 3-4, (d) pH = 8-9. Figure S9. Photographs of (left) OA-capped NPs dispersed in cyclohexane and (right) PAAcapped NPs dispersed in water. S4 Figure S10. Calibration curve for Gd3+ in aqueous solution: aqueous calibration samples (circles); aqueous dispersion of PAA-capped GdF3 NPs (0.1 mM of Gd3+) 20-fold diluted (square); [xylenol orange] = 90 μM. The absorbance of 20-fold diluted sample is 0.077, and the content of free Gd3+ ions is estimated as 8%. Calculation of surface area (S) and hydrodynamic radius (a) For plate: The diameter of hydrodynamic equivalent sphere is roughly equal to length along the long diagonal. We defined length along short diagonal as b, thickness as c, and the length of side as d. As the model is proportional to our synthesized NPs, we set R = 1.97, b = 1.30, and c = 0.78 (R : b : c = 10.6 : 7.0 : 4.2, and Volume = R×(b/2)×c = 1). 𝑅 𝑏 d = √( 2 )2 + (2)2 = 1.18 Splate = 2×[R×(b/2)]+4×(d×c) = 6.24 aplate = R/2 = 0.99 For sphere: The hydrodynamic equivalent sphere is actually the sphere itself, and R is the diameter of sphere. 4𝜋 We define radius of sphere as asphere, and asphere = 0.62 (since V = 3 𝑎3 =1). Ssphere = 4π𝑎2 =4.83 S5

