Supplementary data: Numerical spatio
advertisement
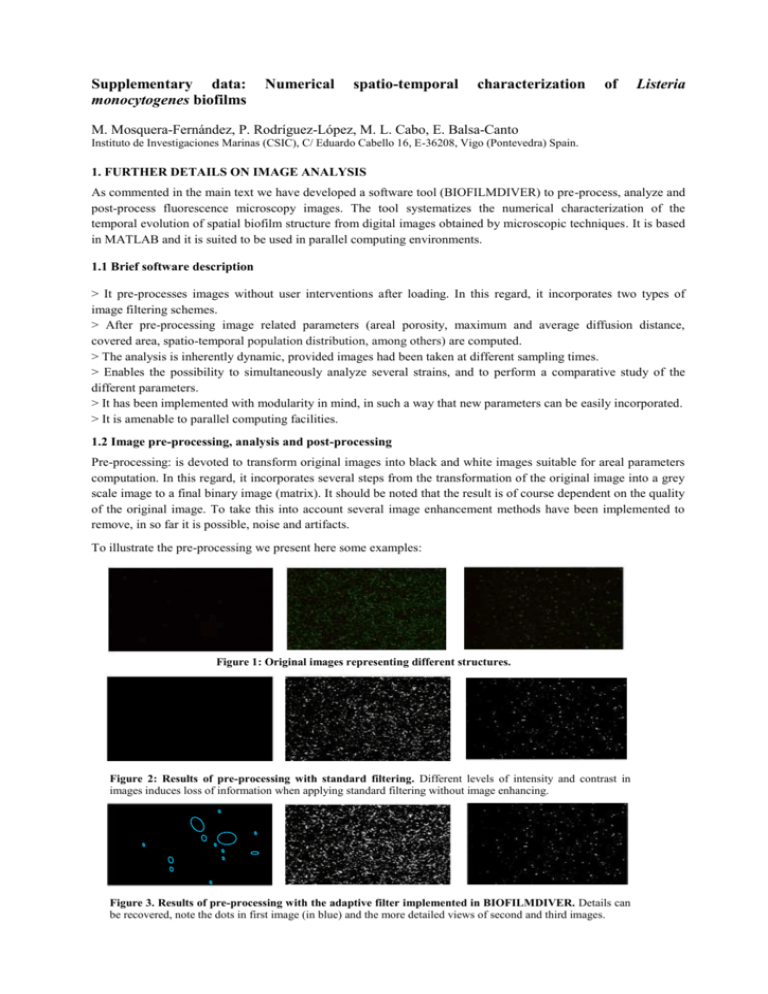
Supplementary data: monocytogenes biofilms Numerical spatio-temporal characterization of Listeria M. Mosquera-Fernández, P. Rodríguez-López, M. L. Cabo, E. Balsa-Canto Instituto de Investigaciones Marinas (CSIC), C/ Eduardo Cabello 16, E-36208, Vigo (Pontevedra) Spain. 1. FURTHER DETAILS ON IMAGE ANALYSIS As commented in the main text we have developed a software tool (BIOFILMDIVER) to pre-process, analyze and post-process fluorescence microscopy images. The tool systematizes the numerical characterization of the temporal evolution of spatial biofilm structure from digital images obtained by microscopic techniques. It is based in MATLAB and it is suited to be used in parallel computing environments. 1.1 Brief software description > It pre-processes images without user interventions after loading. In this regard, it incorporates two types of image filtering schemes. > After pre-processing image related parameters (areal porosity, maximum and average diffusion distance, covered area, spatio-temporal population distribution, among others) are computed. > The analysis is inherently dynamic, provided images had been taken at different sampling times. > Enables the possibility to simultaneously analyze several strains, and to perform a comparative study of the different parameters. > It has been implemented with modularity in mind, in such a way that new parameters can be easily incorporated. > It is amenable to parallel computing facilities. 1.2 Image pre-processing, analysis and post-processing Pre-processing: is devoted to transform original images into black and white images suitable for areal parameters computation. In this regard, it incorporates several steps from the transformation of the original image into a grey scale image to a final binary image (matrix). It should be noted that the result is of course dependent on the quality of the original image. To take this into account several image enhancement methods have been implemented to remove, in so far it is possible, noise and artifacts. To illustrate the pre-processing we present here some examples: Figure 1: Original images representing different structures. Figure 2: Results of pre-processing with standard filtering. Different levels of intensity and contrast in images induces loss of information when applying standard filtering without image enhancing. Figure 3. Results of pre-processing with the adaptive filter implemented in BIOFILMDIVER. Details can be recovered, note the dots in first image (in blue) and the more detailed views of second and third images. As indicated in the main text the following parameters were considered in this work: Areal Porosity (AP), Average Diffusion Distance (ADD) and Maximum Diffusion Distance (MDD), covered area (CA) and the Spatio-temporal bacterial Population Distribution (STPD) adhered to surface. Areal porosity (AP) is defined as ratio of the unoccupied area and the total image area. In binary images, AP is the result of the ratio of number of ‘zero’ pixels and the total number of pixels of image. Diffusion Distance (DD) is defined as the minimum distance between each pixel contained into a cluster to the nearest pixel contained in the unoccupied area. Diffusion distance is calculated in binary images by means of ‘distance mapping’. The calculation of distance mapping is as follows: 𝐿 (𝑆) is defined as distance between one pixel of 𝑆 to the nearest pixel of 𝑆 (Danielson, 1980), where S represents a set of ‘ones’ of image and S represent a set of ‘zeros’ of image corresponding to the unoccupied area. The calculation of L (S) for each element at 𝑆, 𝑆 → 𝐿 (𝑆), is kwon as ‘distance mapping’. The Average (ADD) and the maximum Diffusion Distances (MDD) are then defined as the average and maximum distances respectively. Covered Area (CA) is somehow similar to the areal porosity but making use of the actual size of the pixel and the total number of pixels in the image. Spatio-temporal Population Distribution: is computed by projecting the information in the different columns of the binary matrix, i.e. the elements of each column are summed up in such a way that one image (matrix) is transformed into a vector. The sequence of images (vectors) are arranged into a matrix of number of sampling times x number of pixels in one dimension and the result is plotted as a three dimension surface where ‘x-axis’ represents location, ‘y-axis’, represents time and ‘z-axis’ represents the amount of black pixels. A B 1 0 0 0 0 0 1 1 1 1 1 1 0 1 1 1 C 0 1 1 0 0 0 1 1 0 1 1 1 0 1 1 1 STPD 0 1 0 0 0 0 0 1 0 1 1 1 0 0 1 1 1 2 1 2 2 1 4 3 3 3 3 2 4 3.5 3 2.5 2 1.5 4 1 3 3 2.5 2 2 1.5 1 1 Figure 4: Illustrative example of STPD computation. A, B and C are binary matrix of three different images at different sampling times during biofilm evolution and STPD is the matrix resultant of STPD parameter calculation from such three images and last figure represents the 3D surface. It is somehow similar to the areal porosity 2. FURTHER DETAILS ON PLATE COUNTS Following figures present the number of adhered cells in log scale (CFU/cm2) obtained for the different strains in the two stainless steel supports: Figure 5: Plate count results for A: L1A1 strain, B: CECT 4032 strain and C: CECT 5873 strain.
