math-7-leq-3
advertisement
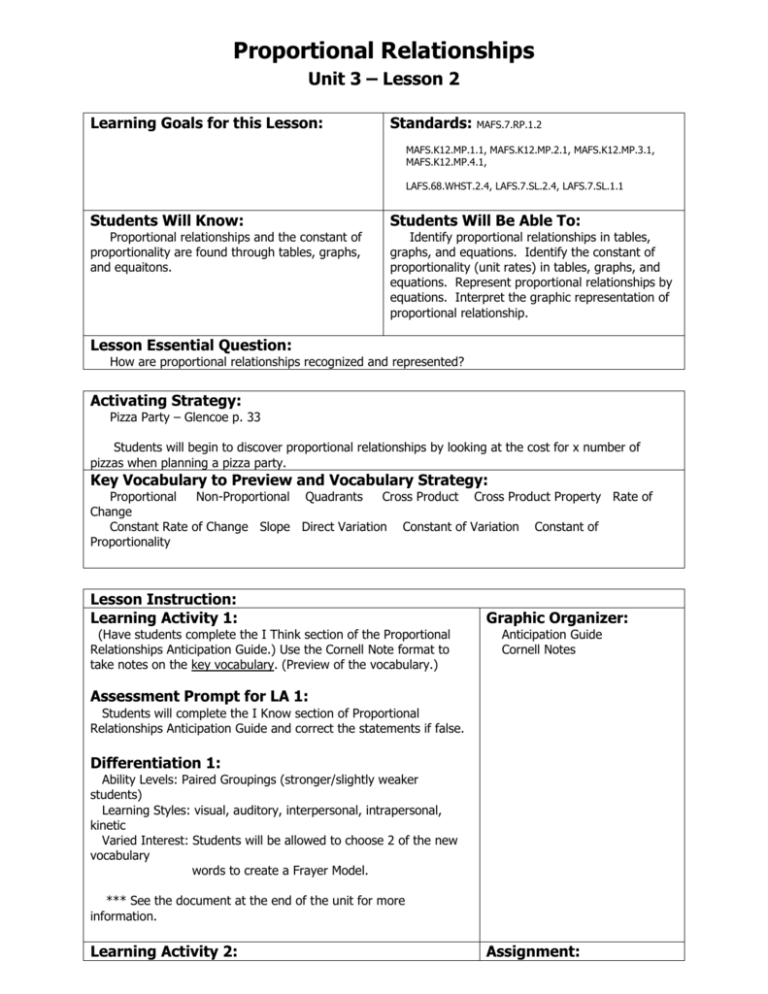
Proportional Relationships Unit 3 – Lesson 2 Learning Goals for this Lesson: Standards: MAFS.7.RP.1.2 MAFS.K12.MP.1.1, MAFS.K12.MP.2.1, MAFS.K12.MP.3.1, MAFS.K12.MP.4.1, LAFS.68.WHST.2.4, LAFS.7.SL.2.4, LAFS.7.SL.1.1 Students Will Know: Students Will Be Able To: Proportional relationships and the constant of proportionality are found through tables, graphs, and equaitons. Identify proportional relationships in tables, graphs, and equations. Identify the constant of proportionality (unit rates) in tables, graphs, and equations. Represent proportional relationships by equations. Interpret the graphic representation of proportional relationship. Lesson Essential Question: How are proportional relationships recognized and represented? Activating Strategy: Pizza Party – Glencoe p. 33 Students will begin to discover proportional relationships by looking at the cost for x number of pizzas when planning a pizza party. Key Vocabulary to Preview and Vocabulary Strategy: Proportional Non-Proportional Quadrants Cross Product Cross Product Property Rate of Change Constant Rate of Change Slope Direct Variation Constant of Variation Constant of Proportionality Lesson Instruction: Learning Activity 1: (Have students complete the I Think section of the Proportional Relationships Anticipation Guide.) Use the Cornell Note format to take notes on the key vocabulary. (Preview of the vocabulary.) Graphic Organizer: Anticipation Guide Cornell Notes Assessment Prompt for LA 1: Students will complete the I Know section of Proportional Relationships Anticipation Guide and correct the statements if false. Differentiation 1: Ability Levels: Paired Groupings (stronger/slightly weaker students) Learning Styles: visual, auditory, interpersonal, intrapersonal, kinetic Varied Interest: Students will be allowed to choose 2 of the new vocabulary words to create a Frayer Model. *** See the document at the end of the unit for more information. Learning Activity 2: Assignment: Discuss the error points and model problems involving solving equations. Be sure to point out/review: When writing a proportion, remind students to line up their units. Tables: - A pattern in the table does not necessarily indicate proportionality. - The arrangement of the table may not match the desired ratio. - The entire table must be checked for proportionality. Remind students that slope is always rise over run. (Run is on the bottom because you run with your legs.) Proportional relationships have graphs that pass through the origin. . After each example section, students complete the “Got It?” questions with their partners. (Ink-Pair-Share.) Assessment Prompt for LA 2: Question: “What relationship exists between rate of change, slope, and direct variation?” Write-Pair-Share As tell the Bs their answer and give their reasoning. Bs follow up – do you agree, disagree, or need to add to? Call on Bs to answer aloud for the class. Differentiation 2: Ability Levels: Paired Groupings (stronger/slightly weaker students) Learning Styles: visual, auditory, interpersonal, intrapersonal, kinetic *** See the document at the end of the unit for more information. Learning Activity 3: Review Marking the Text to students. Review the 4 parts (underline the question, circle operational words, highlight values, and translate word problems into a numerical sentence). Remind students that Marking the Text can help them to solve word problems by helping to better understand the questions before solving it. Review how to use Marking the Text with students using a problem involving equations. Provide students with an additional word problem (proportional relationsips) to solve. (Ink-Pair-Share) Assessment Prompt for LA 3: Complete word problems pertaining to the LEQ using the Marking the Text Strategy with their partners. Differentiation 3: Ability Levels: Paired Groupings (stronger/slightly weaker students) Learning Styles: visual, auditory, interpersonal, intrapersonal, kinetic Varied Interest: Create and solve their own word problem. *** See the document at the end of the unit for more Performance Task– Road Trip (Textbook p. 93) In this activity, students apply their knowledge of proportional relationships in the real-world context of calculating gas mileage. Rubric: See p. PT1 information. Learning Activity 4: Review the Higher Order Thinking Skills to the students. Review how to solve word problem involving a H.O.T. skill that involve equations. Remind students to use the Marking the Text strategy. Provide students with an additional H.O.T. problem to solve. (Ink-Pair-Share) Assessment Prompt for LA 4: Complete H.O.T problems pertaining to the LEQ using the Marking the Text Strategy with their partners. Differentiation 4: Ability Levels: Paired Groupings (stronger/slightly weaker students) Learning Styles: interpersonal, intrapersonal, kinetic Varied Interest: Choose two of the H.O.T questions from the textbook related content. *** See the document at the end of the unit for more information. Summarizing Strategy: Students will review their Cornell Notes to answer the LEQ in the Summary section. Students: Modifications/Accomodations: 1. Seat student near teacher. 2. Stand near student when giving directions/presenting. 3. Provide visual aids/graphic organizers. 4. Ensure oral directions are understood. 5. Allow extra time to complete tasks. 6. Simplify complex written directions. 7. Give test items orally. 8. Provide peer assistance/study groups. Proportional Relationships Anticipation Guide Please answer the following statements/problems as True or False in the “I think” column first. At the end of class you will review these statements/problems again and then you will write the correct True or False answer in the “I know” column. If the answer if false, then correct the statement somehow to make it true. I Think I Know Statement Two quantities that have a constant ratio or unit rate are proportional. Two quantities that do not have a constant ratio or unit rate are non-proportional. The three regions of a coordinate plane are called quadrants. The Cross Product Property states that the cross products of any proportion are equal. The cross product is a rate that describes how one quantity changes in relation to another. A non-linear relationship has a constant rate of change. Slope is the rate of change between any two points on a line. When two variables have a constant ratio, their relationship is called an Inverse Variation. The constant ratio is not called the constant rate of change. The constant of variation is also know as the constant of proportionality.
