7A Graphing Quadratic Functions Practice
advertisement
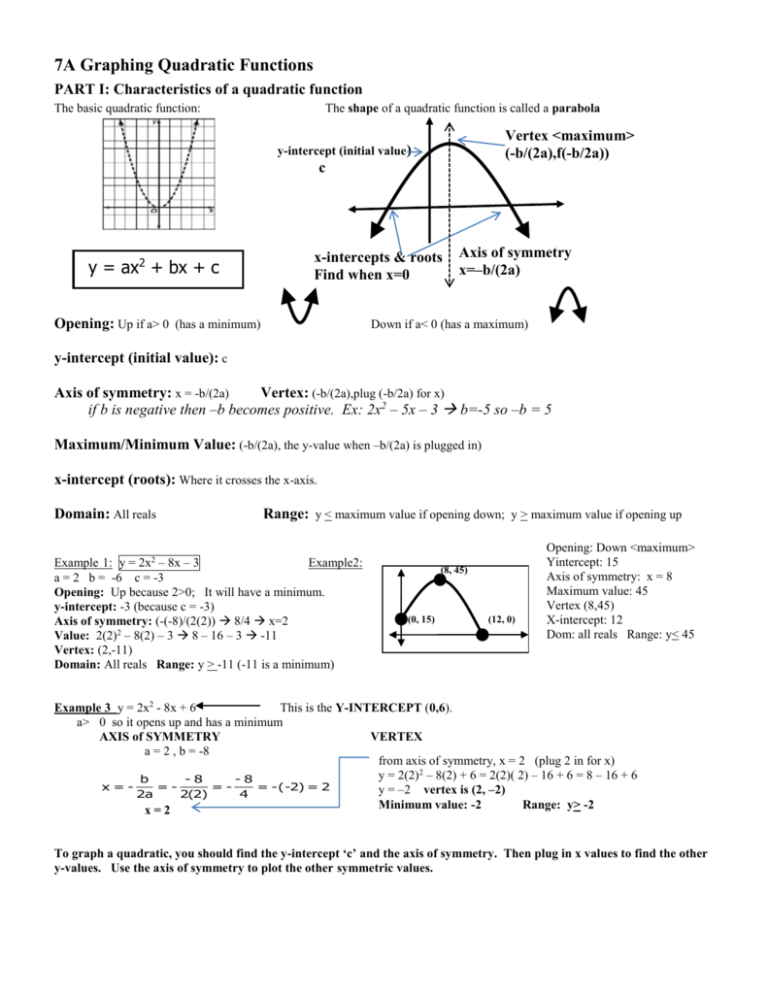
7A Graphing Quadratic Functions PART I: Characteristics of a quadratic function The basic quadratic function: The shape of a quadratic function is called a parabola Vertex <maximum> (-b/(2a),f(-b/2a)) y-intercept (initial value) c y = ax2 + bx + c x-intercepts & roots Find when x=0 Opening: Up if a> 0 (has a minimum) Axis of symmetry x=–b/(2a) Down if a< 0 (has a maximum) y-intercept (initial value): c Axis of symmetry: x = -b/(2a) Vertex: (-b/(2a),plug (-b/2a) for x) if b is negative then –b becomes positive. Ex: 2x2 – 5x – 3 b=-5 so –b = 5 Maximum/Minimum Value: (-b/(2a), the y-value when –b/(2a) is plugged in) x-intercept (roots): Where it crosses the x-axis. Domain: All reals Range: y < maximum value if opening down; y > maximum value if opening up Example 1: y = 2x – 8x – 3 Example2: a = 2 b = -6 c = -3 Opening: Up because 2>0; It will have a minimum. y-intercept: -3 (because c = -3) Axis of symmetry: (-(-8)/(2(2)) 8/4 x=2 Value: 2(2)2 – 8(2) – 3 8 – 16 – 3 -11 Vertex: (2,-11) Domain: All reals Range: y > -11 (-11 is a minimum) 2 (8, 45) (0, 15) (12, 0) Opening: Down <maximum> Yintercept: 15 Axis of symmetry: x = 8 Maximum value: 45 Vertex (8,45) X-intercept: 12 Dom: all reals Range: y< 45 Example 3 y = 2x2 - 8x + 6 This is the Y-INTERCEPT (0,6). a> 0 so it opens up and has a minimum AXIS of SYMMETRY VERTEX a = 2 , b = -8 from axis of symmetry, x = 2 (plug 2 in for x) y = 2(2)2 – 8(2) + 6 = 2(2)( 2) – 16 + 6 = 8 – 16 + 6 b -8 -8 x==== -(-2) = 2 y = –2 vertex is (2, –2) 2a 2(2) 4 Minimum value: -2 Range: y> -2 x=2 To graph a quadratic, you should find the y-intercept ‘c’ and the axis of symmetry. Then plug in x values to find the other y-values. Use the axis of symmetry to plot the other symmetric values. Example 4: Graph y = -x2 –4x – 5 and find the rate of change from [-1,0] a = -1; b = -4; c= -3 a<0 so it opens down and has a maximum y-intercept: -5 so (0,-3) Axis of symmetry: (-b/(2a)) -(-4)/(2(-1)) x= -2 x -2 -1 0 -3 Y -(-2)2 – 4(-2) – 3 -(-2)(-2) + 8 – 3 -4 + 8 – 3 -1 (-2, 1) -(-1)2 – 4(-1) – 3 -(-1)(-1) + 4 – 3 -1 + 4 – 3 0 (-1,0) (0.-3) -(-3)2 – 4(-3) - 1 -(-3)(-3) + 12 – 3 -9 + 12 – 3 0 (-3,0) -3 1 Rate of change from [-1 to 0] (-2,0) to (0,-3) 3 0 3 3 0 (1) 1 Practice: 1-7 Identify the a) opening (up or down) b) does it have a maximum or minimum c) the y-intercept d) the axis of symmetry e) vertex f) domain g) range . Verify with calculator. 1. y = -3x2 + 6x – 5 2. y = 4x2 + 16x + 8 3. y = -5x2 – 30x – 25 4. y = -4x2 + 20x x=- b ( ) == 2a 2( ) 5. y = -x2 + 4x + 6 x=- b ( ) == 2a 2( ) 6. y = -2x2 – 12x + 2 7. Height of a ball is given by h(t) = -t2 + 6t + 8 7A Graphing Quadratic Functions Practice 8-10 For each of the following graphs, identify the a) opening (up or down) b) does it have a maximum or minimum c) the y-intercept d) x-intercept (if any) e) the axis of symmetry f) vertex g) domain h) range i) rate of change from [0 to 2] 8. 9. 10. Opening: Min/max? Y-intercept: X-intercept: AOS: Vertex: Domain: Range: Rate of change: 11. The graph to the left represents one of the arches of the McDonalds’ logo. The units are in feet. a) Based on the graph, what is the maximum height? b) What are roots? c) When x is 5, what is y? d) What is the range. 12-15. Graph the following equations on your graph paper. Then identify the a) y-intercept b) axis of symmetry c) vertex and d) approximate values of the x-intercepts e) range and f) rate of change from [0 to 2] 12. y= 2x2 – 12x + 5 13. y= –x2 + 8x - 6 14. y = -x2 + 4x - 3 15. h(t) = -2t2 + 8t + 1 16-20. Match the equations with their graphs. Give explanations. 16. y= -x2 - x + 2 17. y = -x2 + 1 18. Y= x2 – 4x + 2 A B C 19. y = 2x2 + 6x + 1 D 20. y=2x2 - 3x + 1 E
