Graphing Quadratic Equations Worksheet
advertisement
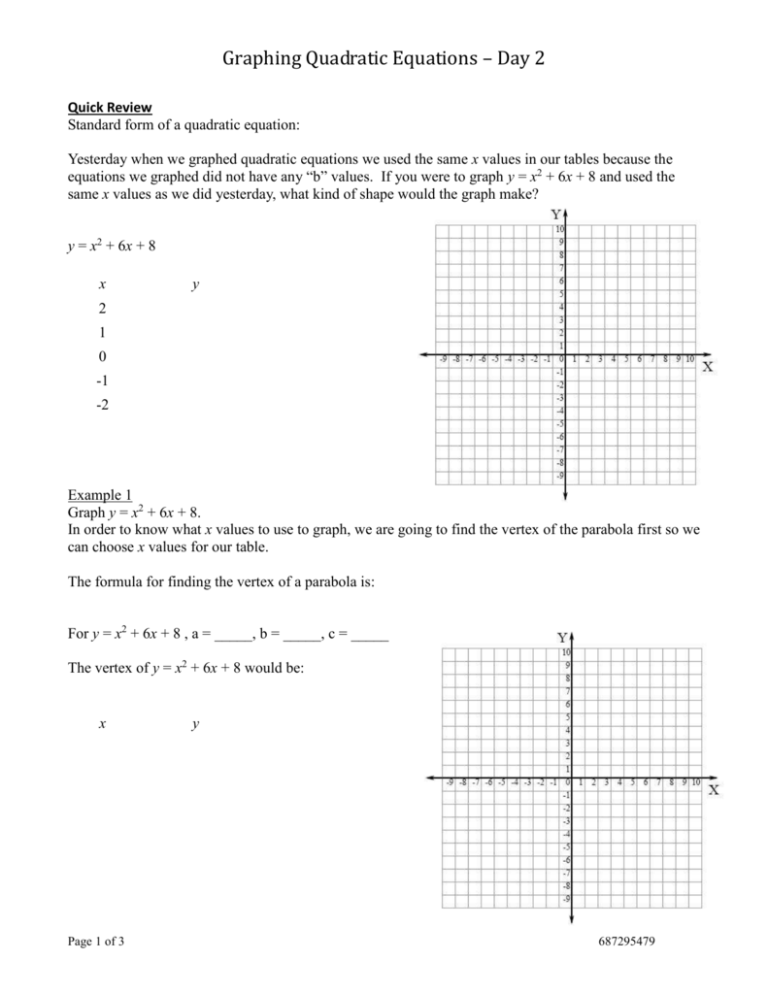
Graphing Quadratic Equations – Day 2 Quick Review Standard form of a quadratic equation: Yesterday when we graphed quadratic equations we used the same x values in our tables because the equations we graphed did not have any “b” values. If you were to graph y = x2 + 6x + 8 and used the same x values as we did yesterday, what kind of shape would the graph make? y = x2 + 6x + 8 x y 2 1 0 -1 -2 Example 1 Graph y = x2 + 6x + 8. In order to know what x values to use to graph, we are going to find the vertex of the parabola first so we can choose x values for our table. The formula for finding the vertex of a parabola is: For y = x2 + 6x + 8 , a = _____, b = _____, c = _____ The vertex of y = x2 + 6x + 8 would be: x Page 1 of 3 y 687295479 Graphing Quadratic Equations – Day 2 Homework Name: _____________________ Example 2: Graph y = -x2 + 6x – 1 (remember to find the vertex first) x y Now you graphed the equation, name the: axis of symmetry: x-intercepts: Example 3: Graph y = 2x2 + 8x + 6 x y axis of symmetry: x-intercepts: Page 2 of 3 687295479 Graphing Quadratic Equations – Day 2 Homework Name: _____________________ Example 3: Graph y = x2 – x – 2 x y axis of symmetry: x-intercepts: Example 4: Graph y = -x2 – 6x – 7 x y axis of symmetry: x-intercepts: Page 3 of 3 687295479
