Heating & Cooling Curves Explained: Phase Changes & Energy
advertisement
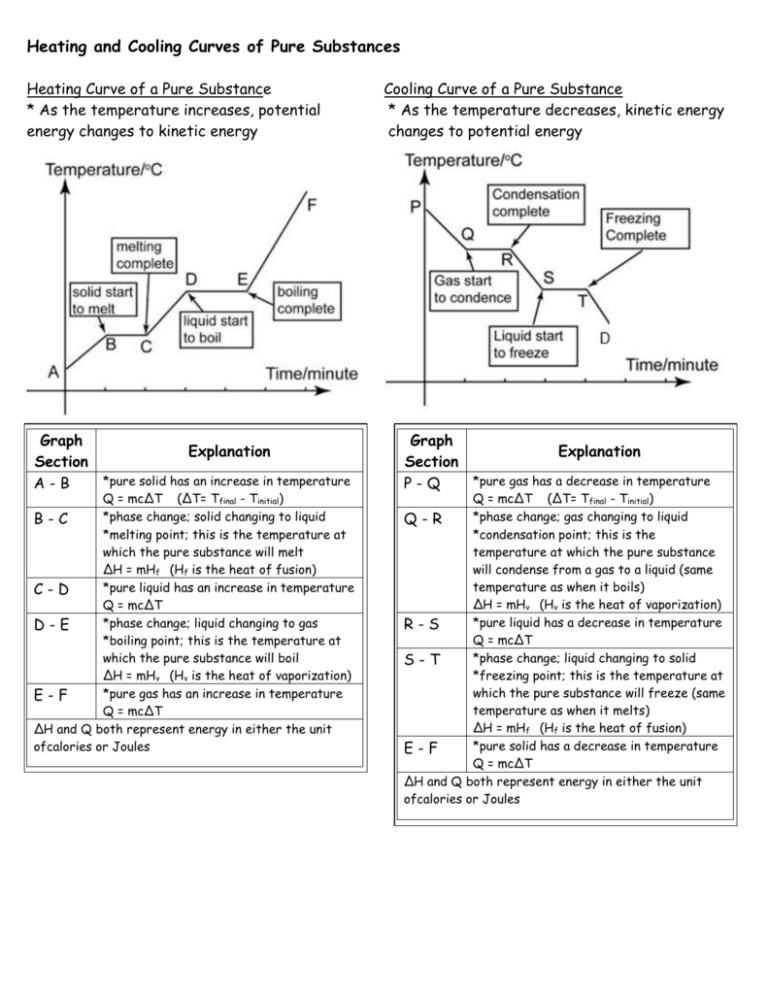
Heating and Cooling Curves of Pure Substances Heating Curve of a Pure Substance * As the temperature increases, potential energy changes to kinetic energy Graph Explanation Section *pure solid has an increase in temperature A-B Q = mc∆T (∆T= Tfinal - Tinitial) *phase change; solid changing to liquid B-C *melting point; this is the temperature at which the pure substance will melt ∆H = mHf (Hf is the heat of fusion) *pure liquid has an increase in temperature C-D Q = mc∆T *phase change; liquid changing to gas D-E *boiling point; this is the temperature at which the pure substance will boil ∆H = mHv (Hv is the heat of vaporization) *pure gas has an increase in temperature E-F Q = mc∆T ∆H and Q both represent energy in either the unit ofcalories or Joules Cooling Curve of a Pure Substance * As the temperature decreases, kinetic energy changes to potential energy Graph Explanation Section *pure gas has a decrease in temperature P-Q Q = mc∆T (∆T= Tfinal - Tinitial) *phase change; gas changing to liquid Q-R *condensation point; this is the temperature at which the pure substance will condense from a gas to a liquid (same temperature as when it boils) ∆H = mHv (Hv is the heat of vaporization) *pure liquid has a decrease in temperature R-S Q = mc∆T *phase change; liquid changing to solid S-T *freezing point; this is the temperature at which the pure substance will freeze (same temperature as when it melts) ∆H = mHf (Hf is the heat of fusion) *pure solid has a decrease in temperature E-F Q = mc∆T ∆H and Q both represent energy in either the unit ofcalories or Joules
