Crop Production Tables 2009-2012
advertisement

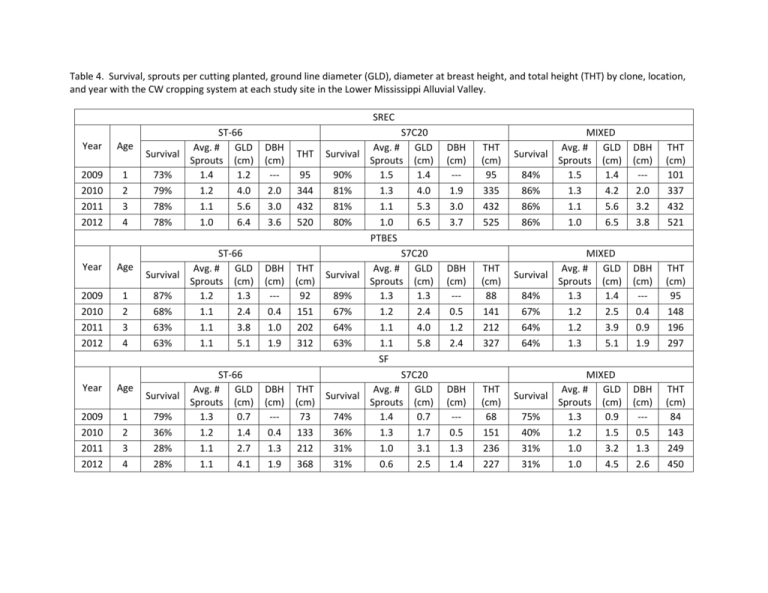
Table 4. Survival, sprouts per cutting planted, ground line diameter (GLD), diameter at breast height, and total height (THT) by clone, location, and year with the CW cropping system at each study site in the Lower Mississippi Alluvial Valley. SREC Year Age 2009 2010 2011 2012 1 2 3 4 Year Age 2009 2010 2011 2012 1 2 3 4 Year Age 2009 2010 2011 2012 1 2 3 4 ST-66 Avg. # GLD Survival Sprouts (cm) 73% 1.4 1.2 79% 1.2 4.0 78% 1.1 5.6 78% 1.0 6.4 ST-66 Avg. # GLD Survival Sprouts (cm) 87% 1.2 1.3 68% 1.1 2.4 63% 1.1 3.8 63% 1.1 5.1 ST-66 Avg. # GLD Survival Sprouts (cm) 79% 1.3 0.7 36% 1.2 1.4 28% 1.1 2.7 28% 1.1 4.1 DBH (cm) --2.0 3.0 3.6 DBH (cm) --0.4 1.0 1.9 DBH (cm) --0.4 1.3 1.9 S7C20 Avg. # GLD THT Survival Sprouts (cm) 95 90% 1.5 1.4 344 81% 1.3 4.0 432 81% 1.1 5.3 520 80% 1.0 6.5 PTBES S7C20 THT Avg. # GLD Survival (cm) Sprouts (cm) 92 89% 1.3 1.3 151 67% 1.2 2.4 202 64% 1.1 4.0 312 63% 1.1 5.8 SF S7C20 THT Avg. # GLD Survival (cm) Sprouts (cm) 73 74% 1.4 0.7 133 36% 1.3 1.7 212 31% 1.0 3.1 368 31% 0.6 2.5 DBH (cm) --1.9 3.0 3.7 DBH (cm) --0.5 1.2 2.4 DBH (cm) --0.5 1.3 1.4 THT (cm) 95 335 432 525 MIXED Avg. # GLD Survival Sprouts (cm) 84% 1.5 1.4 86% 1.3 4.2 86% 1.1 5.6 86% 1.0 6.5 DBH (cm) --2.0 3.2 3.8 THT (cm) 101 337 432 521 THT (cm) 88 141 212 327 MIXED Avg. # GLD Survival Sprouts (cm) 84% 1.3 1.4 67% 1.2 2.5 64% 1.2 3.9 64% 1.3 5.1 DBH (cm) --0.4 0.9 1.9 THT (cm) 95 148 196 297 THT (cm) 68 151 236 227 MIXED Avg. # GLD Survival Sprouts (cm) 75% 1.3 0.9 40% 1.2 1.5 31% 1.0 3.2 31% 1.0 4.5 DBH (cm) --0.5 1.3 2.6 THT (cm) 84 143 249 450 Table 5. Percent biomass components for cottonwood trees in the middle of their fourth growing season at three study sites in the Lower Mississippi Alluvial Valley. Study Site SREC Clone S7C20 ST66 Mixed Avg for SREC PTBES Avg. for SF Percent OD Aboveground Woody Biomass Bole Branches 68% 32% 71% 29% 70% 30% 70% 30% S7C20 ST66 Mixed 37% 39% 37% 38% 33% 32% 30% 32% 31% 29% 33% 31% 57% 60% 59% 58% 43% 40% 41% 42% S7C20 ST66 Mixed 48% 48% 51% 49% 23% 21% 21% 22% 29% 31% 28% 29% 70% 73% 73% 72% 30% 27% 27% 28% Avg for PTBES SF Percent Green Aboveground Components Bole Branches Leaves 51% 27% 22% 54% 26% 20% 52% 27% 21% 52% 27% 21% Table 6. Average and maximum oven dry aboveground biomass for four-year old cottonwoods grown in the CW treatment at each study site in the Lower Mississippi Alluvial Valley, reported in short tons/acre and kg/ha. Study Site SREC PTBES SF Study Site SREC PTBES SF ST-66 4.7 1.2 0.9 Mean (tons/acre) S7C20 5.0 1.9 1.2 Mixed 5.9 1.3 1.4 ST-66 10,471 2,603 2,001 Mean (kg/ha) S7C20 11,285 4,247 2,659 Mixed 13,255 2,937 3,047 ST-66 9.8 3.8 2.5 Maximum (tons/acre) S7C20 9.1 5.1 3.1 Mixed 9.3 4.5 4.0 ST-66 22,085 8,444 5,268 Maximum (kg/ha) S7C20 20,347 11,352 6,895 Mixed 20,828 10,135 8,963 Table 7. Average annual oven dry aboveground biomass switchgrass grown in the CW treatment at each study site in the Lower Mississippi Alluvial Valley for years 2 through 4. Calendar Year 2010 2011 2012 SREC N/A N/A N/A OD kg/ha PTBES 4,335 14,168 8,391 SF 3,221 6,960 13,388 Table 8. Average annual oven dry (OD) biomass crop production (kg/ha) at each of the three study sites in the Lower Mississippi Alluvial Valley. Years 2009, 2011, and 2012 are soybean, year 2010 is grain sorghum. Calendar year 2009 (soybeans) 2010 (grain sorghum) 2011 (soybeans) 2012 (soybeans) Study Site SREC PTBES SF SREC PTBES SF SREC PTBES SF SREC PTBES SF Total 1,805 3,769 3,222 14,771 9,696 15,677 4,360 3,616 1,684 3,421 4,432 6,097 OD kg/ha Grain 605 2,045 161 3,631 871 273 1,713 1,803 336 1,113 1,861 2,273 Residue 1,200 1,725 3,061 11,139 8,824 15,404 2,647 1,814 1,348 2,308 2,571 3,824 Table 9. Cumulative cottonwood, switchgrass, and grain seed and residue biomass production (oven dry kg/ha) at three study sites in the Lower Mississippi Alluvial Valley over the 2009-2012 growing seasons. Switchgrass average production is for three years (2010-2012). SREC Cottonwood (average of all varieties) 11,670 PTBES 3,262 26,894 21,513 6,579 14,934 SF 2,569 23,569 26,679 3,042 23,636 SREC 2,918 --- 6,089 1,765 4,323 PTBES 816 8,965 5,378 1,645 3,733 SF 642 7,856 6,670 761 5,909 Study site Total Average Control Switchgrass Total Grain seed Residue --- 24,356 7,062 17,294


