Project #3
advertisement
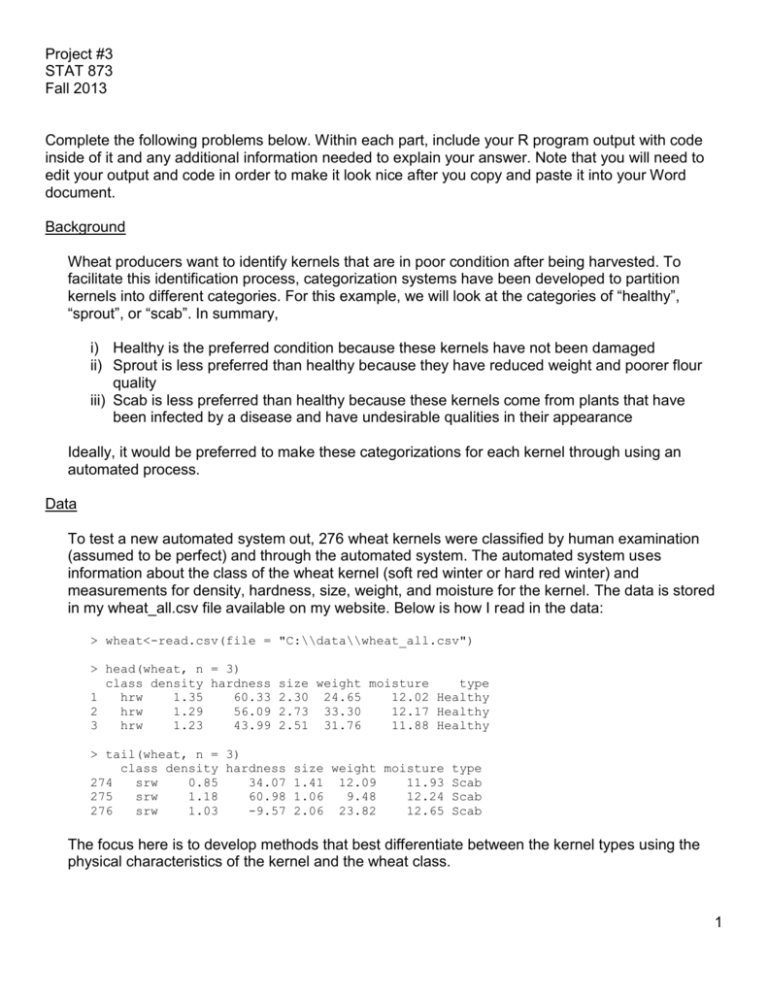
Project #3 STAT 873 Fall 2013 Complete the following problems below. Within each part, include your R program output with code inside of it and any additional information needed to explain your answer. Note that you will need to edit your output and code in order to make it look nice after you copy and paste it into your Word document. Background Wheat producers want to identify kernels that are in poor condition after being harvested. To facilitate this identification process, categorization systems have been developed to partition kernels into different categories. For this example, we will look at the categories of “healthy”, “sprout”, or “scab”. In summary, i) Healthy is the preferred condition because these kernels have not been damaged ii) Sprout is less preferred than healthy because they have reduced weight and poorer flour quality iii) Scab is less preferred than healthy because these kernels come from plants that have been infected by a disease and have undesirable qualities in their appearance Ideally, it would be preferred to make these categorizations for each kernel through using an automated process. Data To test a new automated system out, 276 wheat kernels were classified by human examination (assumed to be perfect) and through the automated system. The automated system uses information about the class of the wheat kernel (soft red winter or hard red winter) and measurements for density, hardness, size, weight, and moisture for the kernel. The data is stored in my wheat_all.csv file available on my website. Below is how I read in the data: > wheat<-read.csv(file = "C:\\data\\wheat_all.csv") > head(wheat, n = 3) class density hardness 1 hrw 1.35 60.33 2 hrw 1.29 56.09 3 hrw 1.23 43.99 size weight moisture type 2.30 24.65 12.02 Healthy 2.73 33.30 12.17 Healthy 2.51 31.76 11.88 Healthy > tail(wheat, n = 3) class density hardness size weight moisture type 274 srw 0.85 34.07 1.41 12.09 11.93 Scab 275 srw 1.18 60.98 1.06 9.48 12.24 Scab 276 srw 1.03 -9.57 2.06 23.82 12.65 Scab The focus here is to develop methods that best differentiate between the kernel types using the physical characteristics of the kernel and the wheat class. 1 1) Perform an initial investigation into the data as follows. a) (10 points) Examine the data using the appropriate graphical methods discussed earlier in the course. In your plots, determine if there may be ways to differentiate among kernel types. Also, examine observation #31 and compare it to the other observations. b) (1 point) This data comes from an actual consulting problem that I worked on in the past. I pointed out observation #31 to the subject-matter researcher, and he concluded that this observation must be a result of a measurement error. For this reason, we decided to remove it from the data set. For the remainder of this project, use an altered version of the data set that has this observation removed. Show how this observation is removed, and show that the number of observations is now 275. 2) This portion of the project applies DA methods to differentiate between the kernel types. a) (10 points) Fill in the table below using the appropriate DA methods: Proportion correct Accuracy method Healthy Sprout Scab Overall DA Priors Linear Proportional Cross-validation Quadratic Proportional Cross-validation Also, provide the 33 classification tables. Which DA method performs the best? For what type of classifications do the methods perform the worse? Fully explain all of your answers. b) (8 points) The DA homework shows a scatter plot where there are two plotting points for each observation. The smaller point denotes the original population for the observation, and the larger point denotes the classification. Construct a similar plot here, but now plot the first two PCs for it. Interpret the plot in the context of what the 33 classification table in b) gives as the correct and incorrect classification rates. Use the LDA cross-validation classifications found in part a) for the plot. 3) This portion of the project applies NNC methods to differentiate between the kernel types. a) (8 points) Determine an appropriate value for K using cross-validation. Set a seed number of 7771 before using NNC so that I can duplicate your results. b) (6 points) With the value of K chosen in a), perform NNC with cross-validation and provide the 33 classification table. For what type of classifications do the methods perform the worse? Set a seed number of 6126 before using knn.cv() so that I can duplicate your results. c) (6 points) Construct a similar plot as done in part 2b) with the NNC classifications obtained in b). Interpret the plot in the context of what the 33 classification table in b) gives as the correct and incorrect classification rates. Compare the plot for this problem to the one found in part 2b). 2


