Bioterrorism Case Study - Quantitative Microbial Risk Assessment
advertisement
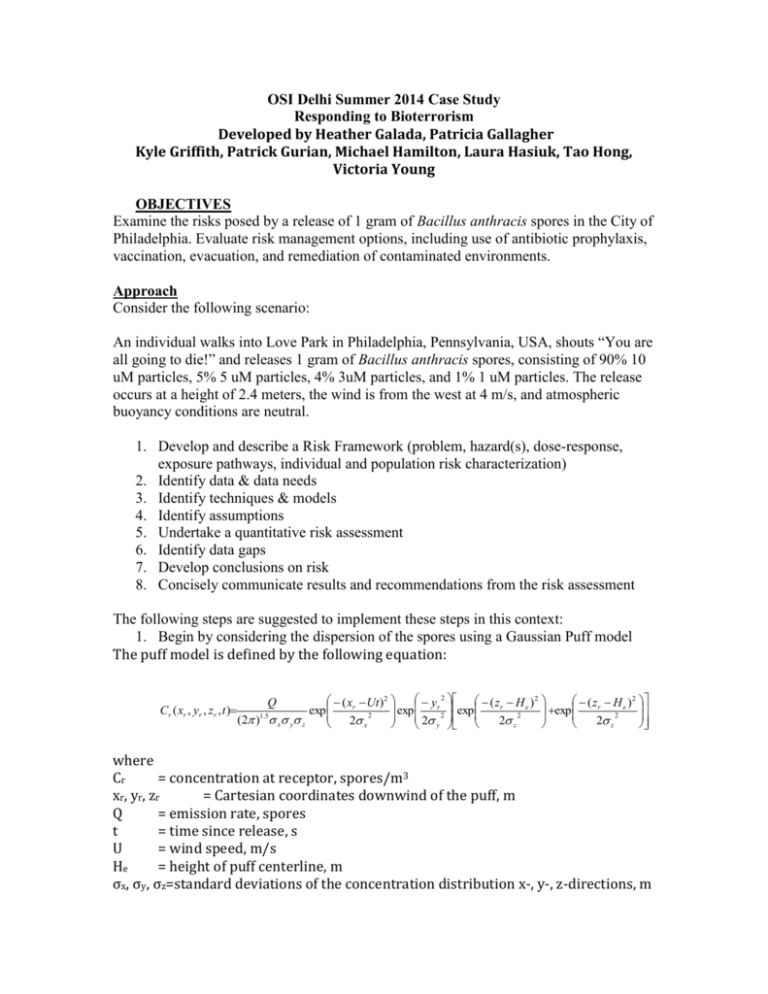
OSI Delhi Summer 2014 Case Study Responding to Bioterrorism Developed by Heather Galada, Patricia Gallagher Kyle Griffith, Patrick Gurian, Michael Hamilton, Laura Hasiuk, Tao Hong, Victoria Young OBJECTIVES Examine the risks posed by a release of 1 gram of Bacillus anthracis spores in the City of Philadelphia. Evaluate risk management options, including use of antibiotic prophylaxis, vaccination, evacuation, and remediation of contaminated environments. Approach Consider the following scenario: An individual walks into Love Park in Philadelphia, Pennsylvania, USA, shouts “You are all going to die!” and releases 1 gram of Bacillus anthracis spores, consisting of 90% 10 uM particles, 5% 5 uM particles, 4% 3uM particles, and 1% 1 uM particles. The release occurs at a height of 2.4 meters, the wind is from the west at 4 m/s, and atmospheric buoyancy conditions are neutral. 1. Develop and describe a Risk Framework (problem, hazard(s), dose-response, exposure pathways, individual and population risk characterization) 2. Identify data & data needs 3. Identify techniques & models 4. Identify assumptions 5. Undertake a quantitative risk assessment 6. Identify data gaps 7. Develop conclusions on risk 8. Concisely communicate results and recommendations from the risk assessment The following steps are suggested to implement these steps in this context: 1. Begin by considering the dispersion of the spores using a Gaussian Puff model The puff model is defined by the following equation: Cr ( xr , yr , zr , t ) y 2 ( zr H e ) 2 ( xr Ut) 2 ( z r H e ) 2 r exp exp exp exp 2 2 2 2 2 (2 )1.5 x y z 2 x 2 z 2 z y Q where Cr = concentration at receptor, spores/m3 xr, yr, zr = Cartesian coordinates downwind of the puff, m Q = emission rate, spores t = time since release, s U = wind speed, m/s He = height of puff centerline, m σx, σy, σz=standard deviations of the concentration distribution x-, y-, z-directions, m Suggested parameters are shown in Table 1. Table 1. Model inputs MODEL INPUTS CONSTANTS Base (variations) 1.3E12 (1.3E11, 1.3E13) 4 (2, 6.7) 2.4384 2.21 3.33E-4 m3/sec 7.43E-6 (9.10E-7, 7.10E-5) C (A, G) Q (spores) U (m/sec) He (m) Solar Radiation Inhalation rate: R value Stability Class Time Step (sec onds) Exposure Time (sec onds) Sourc e Height (m) Inhalation Height Range (m) 300 1800 2.4384 1.17 - 1.67 Dispersion Parameters for Instantaneous Releases Dispersion Parameter σy σz Stability Equation (x in meters) Unstable Neutral Very stable Unstable Neutral Very stable 0.14x 0 .9 2 0.06x 0 .9 2 0.02x 0 .8 9 0.53x 0 .7 3 0.15x 0 .7 0 0.05x 0 .6 1 Sourc e for dispersion parameters: Islitzer and Slade 1968. 1) Based on the concentration profile over time, estimate the dose to humans (see QMRA Wiki for dose response information) and the deposition of the spores onto surfaces (the ground, walls of buildings, etc., see Hong et al. 2010 for deposition rate information). 2) Indoor exposure may be modeled with a completely mixed compartment model dMin/dt = QCout -QCin - kdepositon VCin where Min is the mass in the indoor air, V is the volume of the indoor space, Cin is the indoor air concentration, and kdeposition is the deposition rate of the spores. The solution to the above differential equation will give the concentration of spores over time. However, Hong and Gurian (2012 see Figure S2 in Supporting Information) have already worked out typical mass distributions of spores by compartment so you can simply take the amount of spores that reached the indoor area: Min = ∑(1-f) Q Couti where Couti is the outdoor concentration at time step i that is obtained from the Gaussian puff model and f is the fraction removed by an HVAC filter (if present) or that is deposited in cracks (if infiltration through cracks is a transport pathway of concern). The principle of superposition applies for first order environmental transport and reaction processes. This principle allows concentrations from different sources to be modeled independently and the resulting concentration profiles summed. You can combine masses that entered the building at different time steps into a single release and obtain the correct net deposition to different surfaces. Then you can apportion this mass deposition among different indoor surfaces according to the rough percentages given by Hong et al. (2012). These surface concentrations can be mapped to risk levels using the figures and tables in Hong et al. (2010) and the actions appropriate to different risk levels identified using a benefit-cost framework such as that of Mitchell-Blackwood et al. (2011) or Hamilton et al. (under review). OUTPUTS Try to identify which actions should be taken in which regions to respond to this risk. For example, at what distance downwind should no action be taken? Document your case study using the report template provided on the QMRA Wiki and develop a 20-minute oral presentation on your results. Specific items that should be addressed in each section of the template are provided at: http://qmrawiki.msu.edu/index.php?title=Case_Studies#tab=Case_Study_Criteria References Hamilton et al. under review “Risk-based decision making for reoccupation of contaminated areas following a wide-area anthrax release”. Hong, T. and P.L. Gurian. 2012. “Characterizing Bioaerosol Risk from Environmental Sampling” Environmental Science and Technology, 46(12):6714-6722. Hong, T., P.L. Gurian, N.F. Dudley Ward. 2010. “Setting Risk-Informed Environmental Standards for Bacillus Anthracis Spores,” Risk Analysis, 30(10):1602-1622. Islitzer, N. F. and Slade, D. H. 1968. Meteorology and Atomic Energy, D. H. Slade, Ed., U. S. Atomic Energy Commission, Office of Information Services. Mitchell-Blackwood, J., P.L. Gurian, C. O’Donnell. 2011. “Finding Risk-based Switchover Points for Response Decisions for Environmental Exposure to Bacillus anthracis,” Human and Ecological Risk Assessment, 17(2):489-509.
