discussion - TSM Resources
advertisement
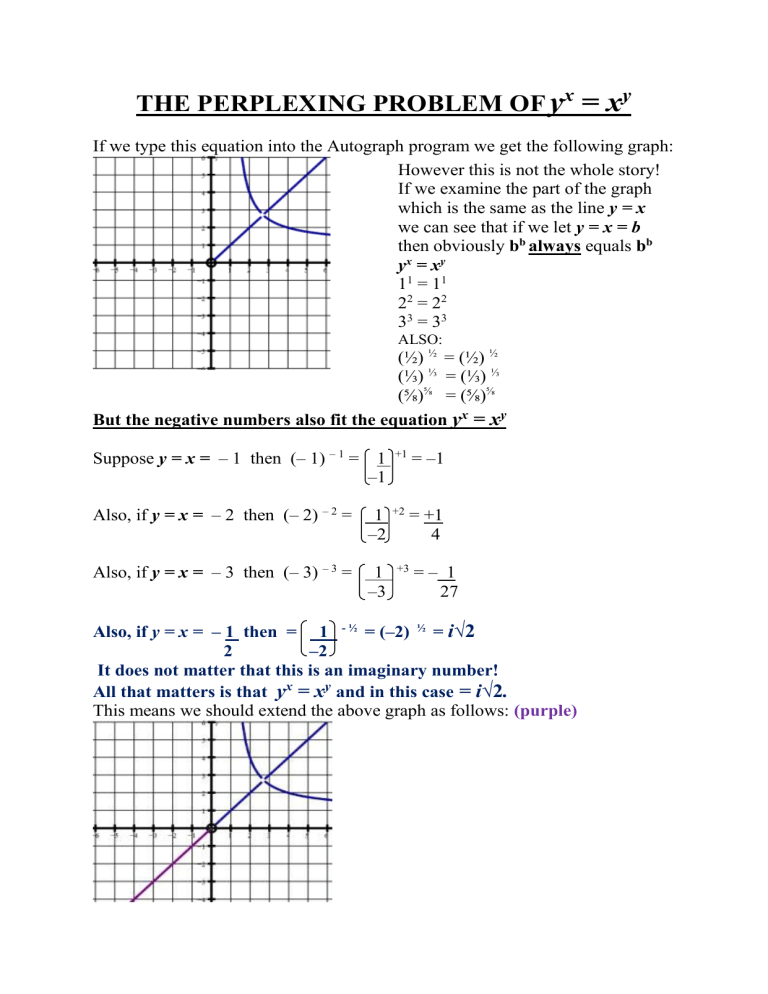
THE PERPLEXING PROBLEM OF yx = xy If we type this equation into the Autograph program we get the following graph: However this is not the whole story! If we examine the part of the graph which is the same as the line y = x we can see that if we let y = x = b then obviously bb always equals bb yx = x y 11 = 11 22 = 22 33 = 33 ALSO: (½) ½ = (½) ½ (⅓) ⅓ = (⅓) ⅓ (⅝)⅝ = (⅝)⅝ But the negative numbers also fit the equation yx = xy Suppose y = x = – 1 then (– 1) – 1 = 1 –1 +1 = –1 Also, if y = x = – 2 then (– 2) – 2 = 1 –2 +2 = +1 4 Also, if y = x = – 3 then (– 3) – 3 = 1 –3 +3 =– 1 27 Also, if y = x = – 1 then = 1 - ½ = (–2) ½ = i√2 2 –2 It does not matter that this is an imaginary number! All that matters is that yx = xy and in this case = i√2. This means we should extend the above graph as follows: (purple) The case of y = x = 0 is a concern of course. Mathematicians always “shy away” from things like this with a glib comment such as “this is not defined”. I think that this is fine in some cases like 0 which we say is “indeterminate”. 0 I like this explanation: If a × b = c × d then a = d c b Suppose a = 6, b = 0, c = 7 and d = 0 So if 6 × 0 = 7 × 0 then 6 = 0 7 0 In other words 0 can equal ANYTHING! 0 (Just substitute any numbers for a and c) It is “indeterminate” as it is, BUT we can “determine” it. eg lim 2xh + h2 = 0 if we just let h = 0 h 0 h 0 BUT if we simplify it first: lim h(2x + h) h 0 h = lim (2x + h) h 0 = 2x HOWEVER I think 00 is a bit different. Consider lim b0 b 0 Obviously (0.000000001)0 = 1 so lim b0 1 b 0 Compare with lim 0 b b 0 Obviously 0 0.000000001 = 0 so lim 0b 0 b 0 I think that 00 can only be 0 or 1 and in this case I believe the sensible conclusion is that 00 0 thus completing the line y = x. So instead of saying 00 is “NOT DEFINED” it seems sensible to simply “DEFINE” it as being equal to 0 in this particular case. (But any purist is welcome to exclude this point if desired.) Incidentally for the graph of y = xx we have the same problem when x = 0 because y = 00 SEE http://screencast.com/t/m4fmGwmkrT9 The full graph of y = xx for REAL values of x (but allowing imaginary y values) is below: Clearly y = lim xx approaches y = 1 from the left and from the right. x 0 So instead of saying 00 is “NOT DEFINED” it seems sensible to simply “DEFINE IT” as being equal to 1 in this particular case. The most interesting types of points on yx = xy are those like (2, 4) and (4, 2) because yx = 42 = 16 and xy = 24 = 16 Suppose we choose y = 5, then we need to solve 5x = x5 to find the x value. Either solving graphically by finding the intersection of Y = 5x and Y = x5 or using the equation solver on a graphics calculator, we get: x = 1.764921915 TESTING: 5 1.764921915 = 17.1248777 and 1.7649219155 = 17.1248777 Suppose we choose y = 6, then solving 6x = x6 we get x = 1.624243846 TESTING: 6 1.624243846 = 18.36146714 and 1.6242438466 = 18.36146714 Choosing y = 3 we get x ≈ 2.478 so we can plot (2.478, 3) and (3, 2.478) Points like the above, produce the part of the curve which resembles a hyperbola. The apparent “hole” at x = 2.719 is very unusual but on solving 2.719x = x2.719 we do get x = 2.719 This means the point x = 2.719, y = 2.719 satisfies yx = xy and this must be the point where the two sections of the graph intersect. So I will fill in the “hole” at (2.719, 2.719) It occurred to me that I should also try x = –2, y = –4 TESTING: (-2) – 4 = ( - ½ )4 = 1 16 (-4) – 2 = ( - ¼ ) 2 = 1 16 Also, considering x = y = –2.718 Obviously (-2.718) – 2.718 = (-2.718) – 2.718 The fact that (-2.718) – 2.718 = -0.04177 – 0.05114i which is a complex number, does not matter as long as it fits yx = xy So we can put the points (-2, -4) and (-4, -2) and (-2.718, -2.718) on the graph. See below: HOWEVER, trying x = –1.76492 and y = – 5 ( –1.76492) – 5 = – 0 .05839457758 BUT ( – 5) –1.76492 = 0.04318 + i 0.03931 Disappointingly, this does not fit the equation yx = xy because yx ≠ xy Similarly, trying x = –2.478 and y = – 3 (–2.478) – 3 = – 0 .0657 BUT ( – 3) –2.478= 0.00454 – i 0.0656 Also this does not fit the equation yx = xy because yx ≠ xy Obviously, I was hoping that the part of the curve resembling a hyperbola would be “reflected” or “rotated” to join up the points (-2, -4) and (-4, -2) and (-2.718, -2.718) in the 3rd quadrant. See RED CURVE below: The following is a slight diversion but it does apply to this problem: Think of y = x2 as a process of MAPPING x values from an x axis onto y values on a y axis as shown below: 0 1 -3 -2 -1 0 1 4 2 3 9 x Firstly 02 = 0 so we join x = 0 to y = 0 0 1 -3 -2 -1 0 1 0 1 4 2 3 9 y x Now if x = ±1, y = +1 -3 -2 -1 0 1 4 2 3 9 y If x = ±2, y = +4 0 1 -3 -2 -1 0 1 0 1 -3 -2 -1 0 1 4 9 4 9 2 3 And if x = ±3, y = +9 2 3 This of course produces the “normal” parabola y = x2. But now let us repeat this process of MAPPING x values from an x PLANE onto y values on a y axis as shown below: -9 -4 -1 0 +1 +4 +9 y axis Complex x PLANE The diagram below shows x = ±3, y = +9 (red), x = ±2, y = +4 (orange) x = ±1, y = +1 (green) and x = 0, y = 0 (brown) -9 -4 -1 0 +1 +4 +9 y axis BUT NOW WE CAN ADD SOME IMAGINARY x VALUES WHICH PRODUCE REAL y VALUES. (This is the whole idea of Phantom Graphs!) Here we add x = ± i which map onto y = – 1 (turquoise) -9 -4 -1 0 +1 +4 +9 y axis +4 +9 y axis Now we add x = ±2i and y = – 4 -9 -4 -1 0 +1 And finally x = ±3i and y = – 9 (yellow) -9 -4 -1 0 +1 +4 +9 y axis Real x axis -3 ≤ x ≤ +3 Imaginary x axis -3i ≤ x ≤ +3i x This of course produces the basic PHANTOM GRAPH of y = x2 if we use the complex x plane and place the vertical y axis through it. y Basic parabola Phantom parabola The whole point in the last 5 pages was to use the idea of mapping complex x values onto complex y values for the problem yx = xy I established earlier that ALL real or imaginary values such as x = y = a + ib must satisfy yx = xy so the following diagram indicates this. Imaginary y values Real y values Real x values Imaginary x values This is x = -1 + 2i mapping onto y = -1 + 2i This is x = 2 + 3i mapping onto y = 2 + 3i The special REAL points referred to earlier, such as the pairs: x = 2, y = 4 and x = 4, y = 2 x = 3, y = 2.48 and x = 2.48, y = 3 x = 5, y = 1.77 and x = 1.77, y = 5 x = 6, y = 1.62 and x = 1.62, y = 6 x = 7, y = 1.53 and x = 1.53, y = 7 x = 8, y = 1.46 and x = 1.46, y = 8 x = 9, y = 1.41 and x = 1.41, y = 9 …can also be placed on a mapping of an x axis to a y axis. 0 1 2 3 4 5 6 7 8 9 y axis 0 1 2 3 4 5 6 7 8 9 x axis (This reminds me of the “curve stitching” that young children do!) The above diagram represents the points which form this curved section resembling a hyperbola. SOME MORE SPECIAL REAL POINTS! Earlier, I referred to the “nice” whole number points (2, 4) and (4, 2) which fit the equation yx = xy . Suppose we were not aware of these solutions and we say to ourselves, “If y = 2, what would x be?” ie Find x if 2x = x2 If we think of this as the intersection of two graphs we could proceed as follows: Draw Y = 2x and Y = x2 (I am using a capital Y because these Y values are not the same as the y values in the equation!) This intersection point gives the value x = 4 so that 24 = 42 (both equal 16) The obvious solution is of course x = 2 because 22 = 22 ! HOWEVER, there is a 3rd solution which is at x ≈ – 0.7667 If we test this 3rd solution we get 2 (– 0.7667) = 0.5878 and (– 0.7667)2 = 0.5878 This method will not produce 3 solutions for ODD y values such as y = 3 because the graphs Y = 3x and Y = x3 only intersect TWICE. Intersection points NO intersection occurs here. We will only get solutions for EVEN y values 4x , 6x , 8x … If we draw Y = 4x and Y = x4 we get graphs which intersect 3 times. The x values at the intersection points are x = 4, 2 and – 0.7667 (again) CHECK: 4 (– 0.7667) = 0.3455 (– 0.7667)4 = 0.3455 We can have: x = 4, y = – 0.7667 AND x = – 0.7667, y = 4 If we draw Y = 6x and Y = x6 we also get graphs which intersect 3 times. The x values are x = 6, 1.624 and – 0.7899 CHECK: 6 (– 0.7899) = 0.2429 (– 0.7899)6 = 0.2429 We can have: x = 6, y = – 0.7899 and x = – 0.7899, y = 6 If we draw Y = 8x and Y = x8 we also get graphs which intersect 3 times. The x values are x = 8, 1.463 and – 0.8101 CHECK: 8(– 0.8101) = 0.1855 (– 0.8101)8 = 0.1855 We can have: x = 8, y = – 0.8101 and x = – 0.8101, y = 8 If we draw Y = 10x and Y = x10 we also get graphs which intersect 3 times. The x values are x = 10, 1.371 and – 0.8267 CHECK: 10(– 0.8267) = 0.1490 (– 0.8267)10 = 0.1490 We can have: x = 10, y = – 0.8267 and x = – 0.8267, y = 10 See below: These are all the solutions of yx= xy found so far! I have not YET found any MORE!!! Apart from the infinite complex solutions of the form x = y = a + ib there are no actual “PHANTOM CURVES” because phantom graphs require A COMPLEX PLANE AND A REAL AXIS. If the equation yx = xy had any complex solutions such as x = a + bi and y = c + id then we would need a complex x plane and a complex y plane which would require 4 dimensional space. However, there may be some values a, b, c, d such that (a + ib)(c + id) = (c + id)(a + ib) but I am still looking!


