Choosing Appropriate and Consistent Scales for Graphs
Scale Handout
Choosing Appropriate and Consistent Scales for Graphs
Suppose you wanted to graph the line H
2 d
250 showing the height of the winter snow pack at a mountain lodge beginning January 1 st
.
H represents the height of the snow in cm. d represents the number of days since January 1 st .
Since H depends on d, the vertical axis will be the H-axis and the horizontal axis will be the d-axis. We need to choose scales for our axes that are appropriate for the given equation.
Here is a table of values for this graph: H
2 d
250 d
0
H
250
10 270
20 290
30 310
The d values range from 0 to 30. It isn’t necessary to graph points with d values like 1 or
12, so we don’t need to let 1 square = 1 unit on the d-axis.
There is not one correct answer for the appropriate scale but it needs to allow for accurate graphing.
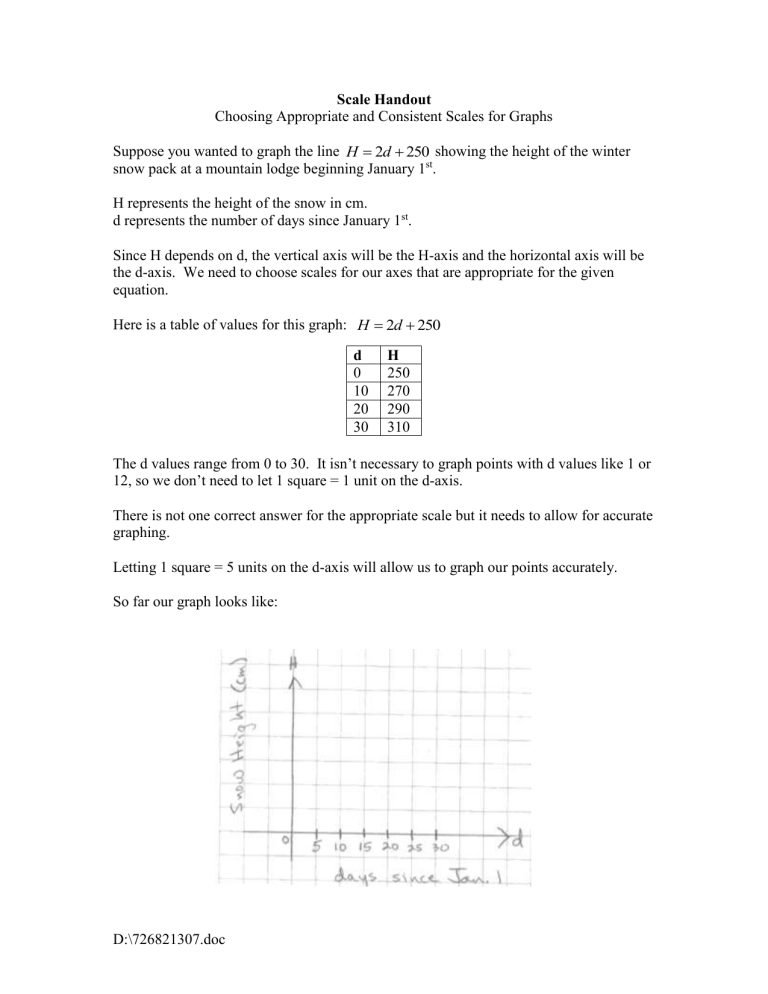
Letting 1 square = 5 units on the d-axis will allow us to graph our points accurately.
So far our graph looks like:
D:\726821307.doc
Now we need to choose our H-scale. The H values range between 250 and 300 so you might be tempted to make your graph look like this:
But this is not acceptable!
The problem with the previous graph is that the axes must cross at the origin (0,0). So on the H-axis the very first square has a value of 250 units and the other squares on the
H-axis have a value of 10 units. The scale must be consistent along the entire axis!
How do we solve this problem?
One option is to sacrifice accuracy and choose a fairly large scale for the H-axis like
1 square = 30 units.
D:\726821307.doc
A second option is to show a break in the axis and use a smaller scale that begins at a number greater than zero.
This break in the axis indicates to the reader that the scale does not begin at zero but still leaves the origin of the graph at (0,0). There may only be one such break in the axis and it can only occur between zero and the number at which the scale begins.
The problem with this is that the graph is only valid above the break. For this graph, since the graph shows the snow pack in January and d=0 represents January 1 st
, there is no need to plot negative d-values, where the H-values would fall below the break at 250.
Never put a break in the axis when the graph continues below the break.
D:\726821307.doc

