Table S1. Details of genotyping protocol used. Site Oligonucleotide
advertisement
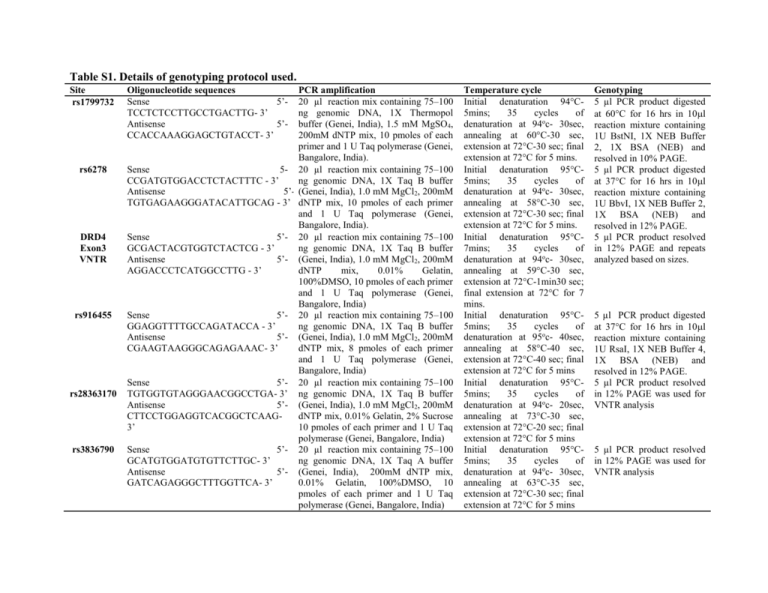
Table S1. Details of genotyping protocol used. Site rs1799732 rs6278 DRD4 Exon3 VNTR rs916455 rs28363170 rs3836790 Oligonucleotide sequences Sense 5’TCCTCTCCTTGCCTGACTTG- 3’ Antisense 5’CCACCAAAGGAGCTGTACCT- 3’ PCR amplification 20 µl reaction mix containing 75–100 ng genomic DNA, 1X Thermopol buffer (Genei, India), 1.5 mM MgSO4, 200mM dNTP mix, 10 pmoles of each primer and 1 U Taq polymerase (Genei, Bangalore, India). Sense 5- 20 µl reaction mix containing 75–100 CCGATGTGGACCTCTACTTTC - 3’ ng genomic DNA, 1X Taq B buffer Antisense 5’- (Genei, India), 1.0 mM MgCl2, 200mM TGTGAGAAGGGATACATTGCAG - 3’ dNTP mix, 10 pmoles of each primer and 1 U Taq polymerase (Genei, Bangalore, India). Sense 5’- 20 µl reaction mix containing 75–100 GCGACTACGTGGTCTACTCG - 3’ ng genomic DNA, 1X Taq B buffer Antisense 5’- (Genei, India), 1.0 mM MgCl2, 200mM AGGACCCTCATGGCCTTG - 3’ dNTP mix, 0.01% Gelatin, 100%DMSO, 10 pmoles of each primer and 1 U Taq polymerase (Genei, Bangalore, India) Sense 5’- 20 µl reaction mix containing 75–100 GGAGGTTTTGCCAGATACCA - 3’ ng genomic DNA, 1X Taq B buffer Antisense 5’- (Genei, India), 1.0 mM MgCl2, 200mM CGAAGTAAGGGCAGAGAAAC- 3’ dNTP mix, 8 pmoles of each primer and 1 U Taq polymerase (Genei, Bangalore, India) Sense 5’- 20 µl reaction mix containing 75–100 TGTGGTGTAGGGAACGGCCTGA- 3’ ng genomic DNA, 1X Taq B buffer Antisense 5’- (Genei, India), 1.0 mM MgCl2, 200mM CTTCCTGGAGGTCACGGCTCAAGdNTP mix, 0.01% Gelatin, 2% Sucrose 3’ 10 pmoles of each primer and 1 U Taq polymerase (Genei, Bangalore, India) Sense 5’- 20 µl reaction mix containing 75–100 GCATGTGGATGTGTTCTTGC- 3’ ng genomic DNA, 1X Taq A buffer Antisense 5’- (Genei, India), 200mM dNTP mix, GATCAGAGGGCTTTGGTTCA- 3’ 0.01% Gelatin, 100%DMSO, 10 pmoles of each primer and 1 U Taq polymerase (Genei, Bangalore, India) Temperature cycle Initial denaturation 94°C5mins; 35 cycles of denaturation at 94oc- 30sec, annealing at 60°C-30 sec, extension at 72°C-30 sec; final extension at 72°C for 5 mins. Initial denaturation 95°C5mins; 35 cycles of denaturation at 94oc- 30sec, annealing at 58°C-30 sec, extension at 72°C-30 sec; final extension at 72°C for 5 mins. Initial denaturation 95°C7mins; 35 cycles of denaturation at 94oc- 30sec, annealing at 59°C-30 sec, extension at 72°C-1min30 sec; final extension at 72°C for 7 mins. Initial denaturation 95°C5mins; 35 cycles of denaturation at 95oc- 40sec, annealing at 58°C-40 sec, extension at 72°C-40 sec; final extension at 72°C for 5 mins Initial denaturation 95°C5mins; 35 cycles of denaturation at 94oc- 20sec, annealing at 73°C-30 sec, extension at 72°C-20 sec; final extension at 72°C for 5 mins Initial denaturation 95°C5mins; 35 cycles of denaturation at 94oc- 30sec, annealing at 63°C-35 sec, extension at 72°C-30 sec; final extension at 72°C for 5 mins Genotyping 5 µl PCR product digested at 60°C for 16 hrs in 10l reaction mixture containing 1U BstNI, 1X NEB Buffer 2, 1X BSA (NEB) and resolved in 10% PAGE. 5 µl PCR product digested at 37°C for 16 hrs in 10l reaction mixture containing 1U BbvI, 1X NEB Buffer 2, 1X BSA (NEB) and resolved in 12% PAGE. 5 µl PCR product resolved in 12% PAGE and repeats analyzed based on sizes. 5 µl PCR product digested at 37°C for 16 hrs in 10l reaction mixture containing 1U RsaI, 1X NEB Buffer 4, 1X BSA (NEB) and resolved in 12% PAGE. 5 µl PCR product resolved in 12% PAGE was used for VNTR analysis 5 µl PCR product resolved in 12% PAGE was used for VNTR analysis Table S2. HHRR performed in nuclear families with ADHD probands (N=148). Gene SNP rs1799732 DRD2 rs6278 Exon3 DRD4 rs916455 rs28363170 SLC6A3 rs3836790 Allele Transmitted C Del G T ≤4R ≥4R C T 9R 10R 5R 6R 0.87 0.13 0.79 0.21 0.93 0.07 0.96 0.04 0.18 0.82 0.26 0.74 Not transmitted 0.84 0.16 0.72 0.28 0.95 0.05 0.94 0.06 0.13 0.87 0.23 0.76 Chi square P value (df=1) 0.34 0.55 2.09 0.15 1.43 0.3 1.6 0.2 2.83 0.09 0.24 0.63 Table S3. Comparative analysis on haplotypic frequencies in controls (120), probands (160) and their parents (N=297). Gene DRD2 DRD4 SLC6A3 Haplotypes Control Proband CG CT DelG DelT ≤4R -C ≤4R -T >4 R -C >4 R -T 9R-5R 9R-6R 10R-5R 10R-6R 0.56 0.3 0.08 0.06 0.91 0.05 0.04 0.0 0.02 0.04 0.17 0.77 0.55 0.19 0.16 0.1 0.86 0.07 0.07 0.002 0.08 0.13 0.19 0.6 Chisquare P value 6.15 0.1 1.29 0.52 10.6 Statistically significant differences are presented in bold. 0.01 Father 0.65 0.2 0.13 0.02 0.88 0.05 0.07 0.07 0.08 0.19 0.66 Chisquare P value 5.86 0.12 0.868 0.648 6 0.11 Mother 0.59 0.24 0.11 0.06 0.89 0.04 0.07 0.006 0.09 0.12 0.17 0.62 Chisquare P value 1.22 0.75 0.95 0.62 10.1 0.02 Table S4. Linkage Disequilibrium analyzed between the studied sites. Proband Father Mother D (r2) D( r2 ) D( r2 ) Gene Marker 1 Marker 2 Control DRD2 rs6278 rs1799732 0.075 (0.002) 0.131 (0.011) DRD4 EX 3 VNTR rs916455 1.0 (0.002) 0.558 (0.002) 0.098 (0.008) 0.063 (0.002) SLC6A3 rs28363170 rs3836790 0.245 (0.017) 0.148 (0.016) 0.018 (0.0) 0.197 (0.032) 0.526 (0.014) 0.065 (0.002) Table S5: Independent and interactive effects of different sites and phenotypic attributes analyzed by MDR. Best Combination in each dimension 1 1-4 -1-2-4 P 3-P Cognitive deficit 1-3-P 1-5-6-P P 1-P Hyperactivity 1-6-P 1-5-6-P Trait TBA PE CVC P value Power 0.6450 0.7123 0.6567 0.9403 0.9360 0.9224 0.8793 0.9497 0.9455 0.9224 0.9150 0.355 0.2877 0.3433 0.0597 0.064 0.0776 0.1207 0.0503 0.0545 0.0776 0.085 8 10 8 10 8 7 7 10 9 7 9 0.0010-0.0020 0.0000-0.0010 0.0010-0.0020 0.0000-0.0010 0.0000-0.0010 0.0000-0.0010 0.0000-0.0010 0.0000-0.0010 0.0000-0.0010 0.0000-0.0010 0.0000-0.0010 100% Nodal No. 1- DRD2 rs1799732, 2- DRD2 rs6278, 3- DRD4 ex 3, 4- DRD4 rs916455, 5- SLC6A3 rs28363170, 6- SLC6A3 rs3836790, P-Phenotypic attributes (cognitive deficit & hyperactivity); No. of attributes= 7; No. of Cross-validation (CV) Intervals chosen= 10; TBA=Testing balance accuracy; PE= Prediction error; CVC= Cross-validation contingency. The model with the maximum TBA, a CVC>5 out of 10 and a minimum PE for that comparison is considered as best model. Table S6. Independent and interactive effects of different sites on various co-morbidities analyzed by MDR. Co-morbidities LD MD ODD CD Best combination in each dimension 1-5 2-4-5 4 1-6 1-2-6 1-2-4-6 1 1-6 1-4-5 4-5 2-4-5 2-4-5-6 TBA PE CVC P value Power 0.6503 0.6523 0.6436 0.7712 0.6905 0.6830 0.6205 0.6402 0.6105 0.7101 0.7031 0.6204 0.3497 0.3477 0.3564 0.2288 0.3095 0.317 0.3793 0.3598 0.3895 0.2899 0.2969 0.3796 6 8 10 10 9 9 10 7 6 10 10 7 0.0010-0.0020 0.0010-0.0020 0.0010-0.0020 0.0000-0.0010 0.0000-0.0010 0.0000-0.0010 0.0300-0.0310 0.0010-0.0020 0.0300-0.0310 0.0000-0.0010 0.0000-0.0010 0.0130-0.0140 100% Nodal No. 1- DRD2 rs1799732, 2- DRD2 rs6278, 4- DRD4 rs916455, 5- SLC6A3 rs28363170, 6- SLC6A3 rs3836790. No. of attributes= 6; No. of Cross-validation (CV) Intervals chosen= 10; TBA=Testing balance accuracy; PE= Prediction error; CVC= Crossvalidation contingency. The model with the maximum Testing BA, a CVC>5 out of 10 and a minimum PE for that comparison is considered as the best model.
