4904 - Emerson Statistics
advertisement
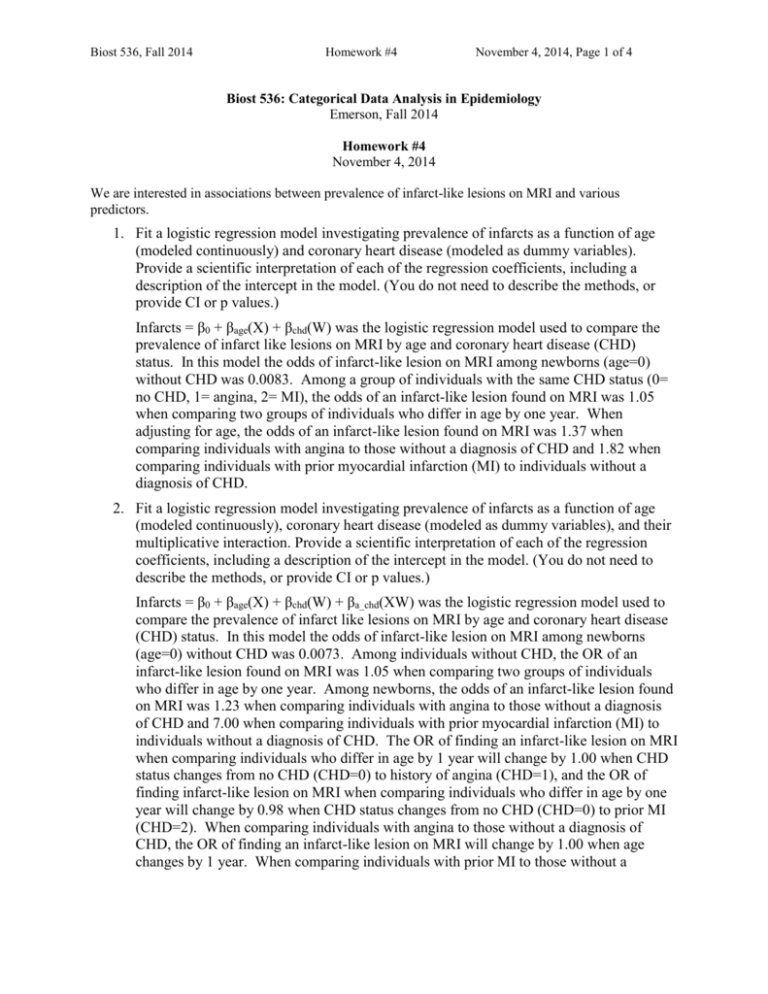
Biost 536, Fall 2014 Homework #4 November 4, 2014, Page 1 of 4 Biost 536: Categorical Data Analysis in Epidemiology Emerson, Fall 2014 Homework #4 November 4, 2014 We are interested in associations between prevalence of infarct-like lesions on MRI and various predictors. 1. Fit a logistic regression model investigating prevalence of infarcts as a function of age (modeled continuously) and coronary heart disease (modeled as dummy variables). Provide a scientific interpretation of each of the regression coefficients, including a description of the intercept in the model. (You do not need to describe the methods, or provide CI or p values.) Infarcts = β0 + βage(X) + βchd(W) was the logistic regression model used to compare the prevalence of infarct like lesions on MRI by age and coronary heart disease (CHD) status. In this model the odds of infarct-like lesion on MRI among newborns (age=0) without CHD was 0.0083. Among a group of individuals with the same CHD status (0= no CHD, 1= angina, 2= MI), the odds of an infarct-like lesion found on MRI was 1.05 when comparing two groups of individuals who differ in age by one year. When adjusting for age, the odds of an infarct-like lesion found on MRI was 1.37 when comparing individuals with angina to those without a diagnosis of CHD and 1.82 when comparing individuals with prior myocardial infarction (MI) to individuals without a diagnosis of CHD. 2. Fit a logistic regression model investigating prevalence of infarcts as a function of age (modeled continuously), coronary heart disease (modeled as dummy variables), and their multiplicative interaction. Provide a scientific interpretation of each of the regression coefficients, including a description of the intercept in the model. (You do not need to describe the methods, or provide CI or p values.) Infarcts = β0 + βage(X) + βchd(W) + βa_chd(XW) was the logistic regression model used to compare the prevalence of infarct like lesions on MRI by age and coronary heart disease (CHD) status. In this model the odds of infarct-like lesion on MRI among newborns (age=0) without CHD was 0.0073. Among individuals without CHD, the OR of an infarct-like lesion found on MRI was 1.05 when comparing two groups of individuals who differ in age by one year. Among newborns, the odds of an infarct-like lesion found on MRI was 1.23 when comparing individuals with angina to those without a diagnosis of CHD and 7.00 when comparing individuals with prior myocardial infarction (MI) to individuals without a diagnosis of CHD. The OR of finding an infarct-like lesion on MRI when comparing individuals who differ in age by 1 year will change by 1.00 when CHD status changes from no CHD (CHD=0) to history of angina (CHD=1), and the OR of finding infarct-like lesion on MRI when comparing individuals who differ in age by one year will change by 0.98 when CHD status changes from no CHD (CHD=0) to prior MI (CHD=2). When comparing individuals with angina to those without a diagnosis of CHD, the OR of finding an infarct-like lesion on MRI will change by 1.00 when age changes by 1 year. When comparing individuals with prior MI to those without a Biost 536, Fall 2014 Homework #4 November 4, 2014, Page 2 of 4 diagnosis of CHD, the OR of finding an infarct-like lesion on MRI will change by 0.98 when age changes by 1 year. 3. Fit a logistic regression model that investigates the linearity of the association between the log odds of presence of infarcts and age, after adjustment for coronary heart disease. (Here you do need to describe your methods and results as they relate to the specific question.) Methods: To determine the association between age and presences of infarct-like lesions on MRI after adjusting for CHD status, the binary indicator of infarct-like lesions on MRI was analyzed using a logistic regression with age categorized into 5 categories (65-69, 70-74, 75-79, 80-84, 85+) and CHD status indicator as 3 categories (0=no CHD, 1= prior angina, 2= prior MI). All regression coefficients of the age categories were simultaneously tested equaling zero using a multiple partial Wald test. The Wald statistic of this test was used to calculate the p value. As predefined secondary analysis, a test of non-linearity was performed if the test of association was found to be statistically significant. In this second test a logistic regression model that included the dummay variables of age, CHD status as categories, and a linear continuous term for age. If the coefficients for one or more dummy variables in the second augmented model were significantly different from zero in a multiple partial Wald test, that would be evidence that suggestive of a non-linear association between infarct-like lesions on MRI and age. The overall test of association was as a gate-keeper in this testing strategy and as a result, the experiment wise type I error of the test of nonlinearity was preserved. Results: The prevalence of finding infarct-like lesions on MRI in the cohort overall was 0.31% (1066/3448). Logistic regression analysis of infarct-like lesions on MRI odds ratio across age groups using a dummy variable model found a statistically significant association between age and infarct-like lesions on MRI (p value <0.0001) after adjusting for CHD status. Since a statistically significant association was found, the second predefined test of nonlinearity in this association was performed. In that analysis the regression coefficients for the dummy variables were not found be jointly statistically significant suggesting we cannot reject the null hypothesis that the association between age and infarct-like lesions on MRI is linear after adjusting for CHD status (p value 0.89). 4. Fit a logistic regression model that investigates whether there is a U-shaped association between the log odds of presence of infarcts and ldl, after adjustment for age. (Here you do need to describe your methods and results as they relate to the specific question.) Methods: To determine the association between LDL cholesterol and presence of infarctlike lesion on MRI after adjusting for age, the binary indicator of infarct-like lesions on MRI was analyzed using a logistic regression on a linear splines model with LDL modeled as categories (0-24, 25-49, 50-174, 175-199, 200+) and age modeled as a continuous linear variable. Ratios of the odds of having an infarct-like lesion on MRI defined by LDL category were evaluated by testing that all regression coefficients for the LDL categories were equal to zero simultaneously. The likelihood ratio test of association was used to determine a two-sided p value based on the standard error of the regression parameters assuming an approximate normal distribution. As a pre-planned second step, a test for a U-shaped association between infarct-like lesions and LDL was Biost 536, Fall 2014 Homework #4 November 4, 2014, Page 3 of 4 performed if there was a significant association between infarct-like lesions on MRI and the linear splines model of LDL. The second test was done to determine if the association between MRI findings and LDL was non-linear. A multiple partial Wald test was performed on the linear splines regression coefficients, and if this analysis found a significant inequality among at least two of the coefficients, that would be interpreted as the association between MRI findings and LDL after adjusting for age was nonlinear. The fitted results from this regression model would then be graphed on LDL to determine if shape of the association. The overall test of association acted as a gate-keeper in this testing strategy, and as a result, the experiment wise type I error of the test of nonlinearity was preserved. Results: The prevalence of finding infarct-like lesions on MRI in the cohort overall was 0.31% (1066/3448). The prevalence of infarct-like lesions on MRI by LDL category were 0.32, 0.34, and 0.32 for LDL categories 0-74, 75-149, ≥ 150 respectively. Among LDL categories, the OR of having infarct-like lesion on MRI when comparing groups who differ in LDL by 1-unit are presented in the table below. Logistic regression analysis of infarct-like lesions on MRI odds ratio across LDL groups using a linear splines model found a statistically significant association between LDL and infarct-like lesions on MRI (p value <0.0001) after adjusting for age. Since a statistically significant association was found, the second predefined test of nonlinearity in this association was performed. In that analysis the regression coefficients for the linear splines variables were found be jointly highly statistically significant suggesting that the association between LDL and infarct-like lesions on MRI is nonlinear after adjusting for age (p value 0.04). A graph of the fitted values for the primary linear splines model is below. Table 1: Odds ratio of having infarct-like lesions on MRI when comparing individuals in the same category that differ in LDL by 1 after adjusting for age. AAI OR (95% CI) 0-74 1.005 (0.988-1.022) 75-149 0.999 (0.996-1.003) ≥ 150 1.008 (1.002-1.014) Biost 536, Fall 2014 Homework #4 November 4, 2014, Page 4 of 4
