Growth of Radish Plants
advertisement
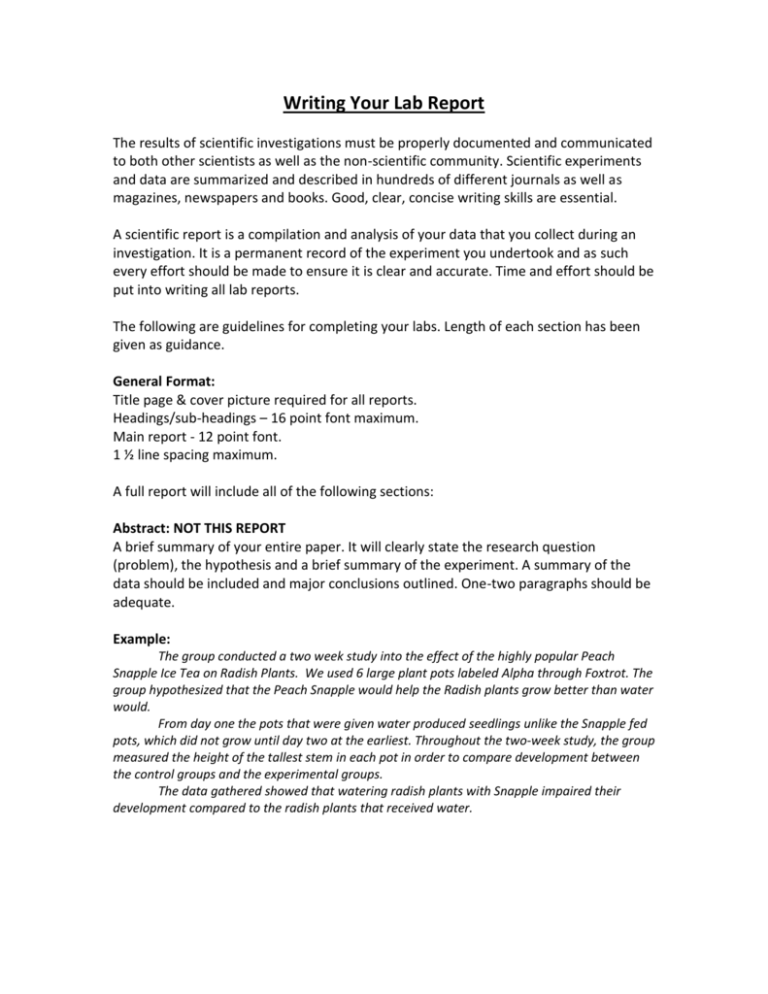
Writing Your Lab Report The results of scientific investigations must be properly documented and communicated to both other scientists as well as the non-scientific community. Scientific experiments and data are summarized and described in hundreds of different journals as well as magazines, newspapers and books. Good, clear, concise writing skills are essential. A scientific report is a compilation and analysis of your data that you collect during an investigation. It is a permanent record of the experiment you undertook and as such every effort should be made to ensure it is clear and accurate. Time and effort should be put into writing all lab reports. The following are guidelines for completing your labs. Length of each section has been given as guidance. General Format: Title page & cover picture required for all reports. Headings/sub-headings – 16 point font maximum. Main report - 12 point font. 1 ½ line spacing maximum. A full report will include all of the following sections: Abstract: NOT THIS REPORT A brief summary of your entire paper. It will clearly state the research question (problem), the hypothesis and a brief summary of the experiment. A summary of the data should be included and major conclusions outlined. One-two paragraphs should be adequate. Example: The group conducted a two week study into the effect of the highly popular Peach Snapple Ice Tea on Radish Plants. We used 6 large plant pots labeled Alpha through Foxtrot. The group hypothesized that the Peach Snapple would help the Radish plants grow better than water would. From day one the pots that were given water produced seedlings unlike the Snapple fed pots, which did not grow until day two at the earliest. Throughout the two-week study, the group measured the height of the tallest stem in each pot in order to compare development between the control groups and the experimental groups. The data gathered showed that watering radish plants with Snapple impaired their development compared to the radish plants that received water. Introduction: This section includes general background information on the topic. It should be a summary of what scientific knowledge there is regarding the problem you are trying to solve. You should gather material from textbooks, journals and online sources. All sources MUST be cited in appropriate MLA/APA format, including parenthetical references. If this is not done then the information may be considered plagiarized, for which you will receive no credit. The lab report will then become invalid and receive a score of zero and an honor code violation will be submitted. Plagiarism is an extremely serious offense. Including words, phrases and sentences and placing them in quotations does not get around being accused of plagiarism. At a minimum you should expect a good introduction to be a page in length. Example: Snapple, a common household drink, was used in the experiment to see if it would boost the growth of radish plants. Peach Snapple contains filtered water, sugar, citric acid, tea, natural flavors (unknown). When the group started the experiment the hypothesis was that the Peach Snapple would be able to boost the growth of the plants. Research shows that citric acid in a pure form has a pH of 1.87. Although the recorded pH of Snapple was not available, because citric acid is a major component in Snapple the drink itself has an acidic pH of between 3 and 4, as measured using pH test strips. The pH of a substance is a measure of the hydrogen ions. It is a logarithmic scale which means that for every unit change on the scale the number of hydrogen ions increases 10 fold. The scale runs from 1-14. Above level 7 is called a base and below level 7 is an acid. Neutral is level 7. Acidic substances have the greatest amount of hydrogen ions. The radish plant is an edible root that came from Europe in pre-Roman times. The radish plants used are the most common ones, a scarlet globe. They are a crisp, red, round, globe looking plant. It has large, rounded, terminal lobes, and 1 to 2 linear leaflets. A radish plant can germinate in up to 1 day. They can grow up to 3 feet when fully matured. In the plant pots that contained water the radish plants germinated in only 1 day. A radish plant is rich in ascorbic acid, folic acid, and potassium. Radish plants grow best in soil with an almost neutral pH of around 6.5-7. (unknown) By adding Snapple to the experimental pots the effect would be to lower the pH of the soil in which the radishes were growing. Acidic soil can be toxic to plant roots. The acid can also change the permeability of the plant cell membranes, which means that the plant will not be able to regulate and control the substances that move in and out of its cells. This can weaken a plant and affect its growth. Acidity of soil can also change the physical properties of the soil as it can change the mineral content and composition. Plants rely on soil minerals such as nitrates, phosphorus, and magnesium for their growth. (Schutt) Materials & Methods: This is a summary of the materials you used and an explanation of what you did. It should be in list, bullet or number format and should be in sufficient detail that someone could replicate your experiment. Example: Materials: 1. Radish Plants 2. Water 3. Snapple Peach tea 4. Large plant pots 5. Graduated cylinders 6. Ruler Method: 1. Take 6 large plant pots and label them Alpha through Foxtrot. 2. Fill each plant pot up to the measuring line with soil. 3. Plant 3 radish seeds exactly a half an inch into the soil. 4. Plant pots labeled Alpha, Bravo, Charlie were the controls and were given 40 ml of water every day. 5. Plant pots labeled Delta, Echo, Foxtrot were the experimental group and were given 40 ml of Peach Tea Snapple every day. 6. Continue steps 4 and 5 every day for two weeks. 7. Take a measurement of the height of the tallest stem in each pot every day. Record in the data table. Results: This section should include tables and graphs that summarize all the data you gathered. Tables and graphs are a great visual representation of data and are generally much easier to read than paragraphs of text. Data tables should never be split onto more than one page. Each table should have a number, e.g. Table 1; table 2 etc and have a title. Graphs should also be numbered but as figure 1, figure 2 etc and they too should have a title. Beneath each table and graph there should be a summary statement of what the table or graph is showing or the trend seen in the data. Example: Table1: Radish growth by day. Day 1 2 3 4 5 6 7 8 Alpha 5 6 7.5 9.5 10.5 13 13 13 Average 9.69 Average by group Height of tallest stem (cm) Control Group Experimental Group Bravo Charlie Delta Echo Foxtrot 5 4 0 0 0 7.5 7 1 0 0 10 8 1 0 0 11 10.5 1 0 0 11 11 1.5 0 0 11 14 2 0 0 12 14 2 0 0 12 15 2 0 0 9.94 10.02 10.44 1.31 0.0 0.44 0.0 Table 1 shows the growth of the plants in each pot over the time of the experiment. As the data shows, the control group grew an average of 10.02cm in the two-weeks that the experiment was running, compared to the experimental group, in which growth was only seen in one of the three pots. Figure1: Growth of control group Height - cm Growth of Radish Plants - Control Group 16 14 12 10 8 6 4 2 0 Alpha Bravo Charlie 1 2 3 4 5 6 7 8 Day Figure 1 shows that all the pots in the control group had growth over the time of the experiment. The plants in the pots labeled Charlie grew the tallest, while the plants in the pot labeled Bravo grew the fastest but slowed after day 4. Conclusion This section must include the following: State whether or not you accept or reject your hypothesis. Explain what your data means. Recognize the limitations of your data, such as sample size. Look critically at the data and explain it thoroughly. If you believe your data is flawed then say so and attempt to explain why. Explain the significance of your results and come to some conclusions, based on the scientific research you did for your introduction. Describe how you would improve the experiment Describe how you could extend the investigation. What other conditions could you consider varying? A full conclusion will be at least a page in length and should have some basis in science. You should tie this section in with the background information you gathered at the start of the report. Example The hypothesis was that the pots that received Peach Tea Snapple would have better growth compared to those that were only given water. The hypothesis was wrong. The pots that received water grew considerably better. Although the data showed a vast difference in the growth of the experimental and control groups it may not be conclusive. Even though three plant pots were used for each group, more could have been set up in order to increase the sample size. The more data you have the more reliable the results are. More seeds could also have been planted in each pot and measurements could have been taken from all the plants, not just the tallest in the pot. A conclusion that can be drawn is that a liquid with a low pH (high acidity level) does not improve the growth of plants. According to the data collected it actually appears to inhibit the growth. In two of the experimental pots there was no growth, so acid conditions may also affect seed germination. This is consistent with the research which stated that acid soil can affect plant growth by weakening the plant and altering the mineral content in the soil. Acidity can also affect membrane permeability. The experiment could have been improved by taking the pH of the Snapple and the soil beforehand, and re-measuring it daily as liquid was added to the soil. More data sets could have been gathered by using more pots and increasing the number of seeds planted. Further experiments based on this investigation could include testing to find out at what pH plants grow best, or using different kinds of acid on plants to see if different acids, other than citric acid affect plant growth. You could also investigate the effect of watering both the plant leaves and the soil with acid solutions to see if the acid affects the plant leaves. Works Cited References used in the report should be listed in alphabetical order. You can use programs such as noodletools (available on computers in the school library) or you can insert references using the toolbar in Microsoft Word. Works Cited Schutt, John. Nitric acid & the growth of radishes. <http://schutt.net/john/science/Nitric_Acid_and_the_Growth_of_Radishes.pdf>. unknown. The Grow Spot. <http://www.thegrowspot.com/know/f7/all-aboutradish-53868.html>.
