Science_MS_DataCollection_Analysis_SLO_2014
advertisement

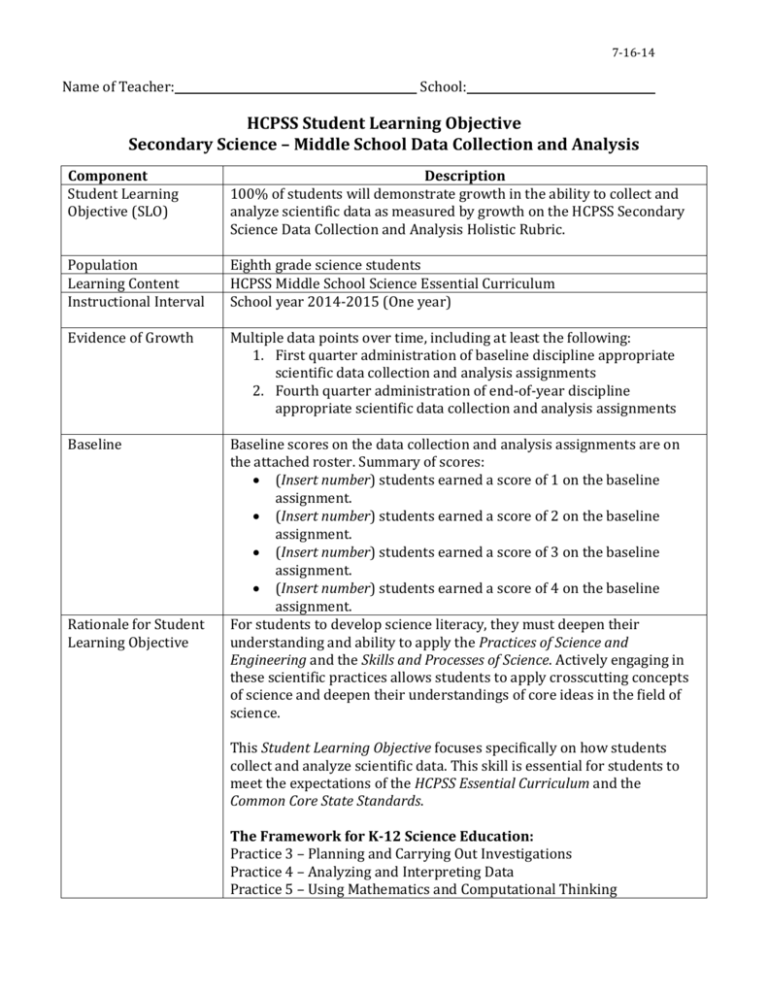
7-16-14 Name of Teacher: School: HCPSS Student Learning Objective Secondary Science – Middle School Data Collection and Analysis Component Student Learning Objective (SLO) Description 100% of students will demonstrate growth in the ability to collect and analyze scientific data as measured by growth on the HCPSS Secondary Science Data Collection and Analysis Holistic Rubric. Population Learning Content Instructional Interval Eighth grade science students HCPSS Middle School Science Essential Curriculum School year 2014-2015 (One year) Evidence of Growth Multiple data points over time, including at least the following: 1. First quarter administration of baseline discipline appropriate scientific data collection and analysis assignments 2. Fourth quarter administration of end-of-year discipline appropriate scientific data collection and analysis assignments Baseline Baseline scores on the data collection and analysis assignments are on the attached roster. Summary of scores: (Insert number) students earned a score of 1 on the baseline assignment. (Insert number) students earned a score of 2 on the baseline assignment. (Insert number) students earned a score of 3 on the baseline assignment. (Insert number) students earned a score of 4 on the baseline assignment. For students to develop science literacy, they must deepen their understanding and ability to apply the Practices of Science and Engineering and the Skills and Processes of Science. Actively engaging in these scientific practices allows students to apply crosscutting concepts of science and deepen their understandings of core ideas in the field of science. Rationale for Student Learning Objective This Student Learning Objective focuses specifically on how students collect and analyze scientific data. This skill is essential for students to meet the expectations of the HCPSS Essential Curriculum and the Common Core State Standards. The Framework for K-12 Science Education: Practice 3 – Planning and Carrying Out Investigations Practice 4 – Analyzing and Interpreting Data Practice 5 – Using Mathematics and Computational Thinking 7-16-14 Target Students who earned a 1 or 2 will earn at least a 3 on a similar assignment. Students who earned 3 or 4 will earn a 3 or 4 on a similar assignment based on more complex performance tasks. *Please note: Students identified by IEP teams as having significant cognitive disabilities will have individual targets. Criteria for Effectiveness Strategies Full Attainment of Target More than 90% of students meet agreed upon learning targets. Partial Attainment of Target Between 75% and 90% of students meet agreed upon learning targets. Insufficient Attainment of Target Less than 75% of students meet agreed upon learning targets. Extensive opportunities for students to engage in data collection and analysis in science through student performance tasks, student labs, and analysis of data collected from reputable sources. Provide opportunities for formative checks on student learning through performance tasks, student labs, or analysis of data collected from reputable sources. Students will review their own performance data and develop individual targets for improvement in identified areas. Students collect work samples throughout the school year for a portfolio that will demonstrate their mastery of Scientific Practices (Skills and Processes). This SLO is a sample. Targets need to be adjusted based on your students’ data. Student growth should be achieved for all students 7-16-14 Middle School - HCPSS Secondary Science Data Collection & Analysis Holistic Rubric Supports Practices 3, 4, & 5 from The Framework for K-12 Science Education and HCPSS Essential Curriculum in Science Data Planning Data Collection Data Presentation Data Collection Fully Developed - 4 Adequately Developed – 3 Partially Developed - 2 Undeveloped - 1 Thorough planning and designing of an investigation to collect a data set at an appropriate level of precision. Adequate planning and designing of an investigation to collect a data set at a mostly appropriate level of precision. Limited planning and designing of an investigation to collect a data set that lacks precision. Inadequate planning and designing of an investigation to collect a data set, or an ineffective level of precision. Data collection reflects appropriate selection and strategic/effective use of tools. Data collection reflects appropriate selection and mostly accurate use of tools. Data collection reflects somewhat appropriate selection and/or inconsistent use of tools. Data collection reflects inappropriate selection and ineffective use of tools. Quantity of data elements/trials and units is reasonable. Quantity of data elements/trials, and units has some inconsistency. Quantity of data elements/trials, and units has many inconsistencies. Quantity of data elements/trials, and units is limited or incomplete. Exemplary presentation of data that effectively uses spreadsheets, databases, tables, charts, or computerbased visualization tools. Sufficient presentation of data that adequately uses spreadsheets, databases, tables, charts, or computer-based visualization tools. Inconsistent presentation of data. Limited use of spreadsheets, databases, tables, charts, or computer-based visualization tools. Ineffective presentation of data. Very limited or incomplete use of spreadsheets, databases, tables, charts, or computer-based visualization tools. Graphical displays clearly show relationships among variables, reflecting appropriate selection and strategic/effective use of tools with grade-appropriate statistical functions. Graphical displays mostly show relationships among variables, reflecting appropriate selection and mostly accurate use of tools with grade-appropriate statistical functions. Graphical displays minimally show relationships among variables, reflecting somewhat appropriate selection and/or inconsistent use of tools. Inconsistently uses gradeappropriate statistical functions. Graphical representations are mostly appropriate for the data and adequate for the intended audience. Graphical representations are somewhat appropriate for the data Graphical representations are appropriate for the data, focused and clear for the intended audience. Graphical displays do not show relationships among variables, reflecting inappropriate selection and ineffective use of tools. Does not use grade-appropriate statistical functions. Graphical representations are not appropriate for the data, or are not present A Score of “0” indicates a blank or incoherent response 7-16-14 Middle School - HCPSS Secondary Science Data Collection & Analysis Holistic Rubric Supports Practices 3, 4, & 5 from The Framework for K-12 Science Education and HCPSS Essential Curriculum in Science Data Communication Data Analysis Fully Developed - 4 Adequately Developed – 3 Partially Developed - 2 Undeveloped – 1 Thoroughly analyzes data to identify patterns and effectively support whether data are consistent with an initial prediction or scientific phenomena. Adequately analyzes data to identify patterns and somewhat supports whether data are consistent with an initial prediction or scientific phenomena. Partially analyzes data to identify patterns and minimally supports whether data are consistent with an initial prediction or scientific phenomena. Inadequately analyzes data to identify patterns and inadequately supports whether data are consistent with initial prediction or scientific phenomena. Clearly identifies and recognizes patterns in data that suggest relationships worth investigating further. Sufficiently identifies and recognizes patterns in data that suggest relationships worth investigating further. Minimally identifies and recognizes patterns in data that suggest relationships worth investigating further. Does not identifies and recognizes patterns in data that suggest relationships worth investigating further. Appropriate calculation/digital tools such as graphical displays (maps, charts, graphs, models and /or tables) are used effectively and accurately to analyze data using grade appropriate statistics (mean, median, mode and variablilty). Appropriate calculation/digital tools such as graphical displays (maps, charts, graphs, models, and/or tables) are mostly used with accuracy to analyze data using grade appropriate statistics (mean, median, mode and variability). Calculation tools such as graphical displays (maps, charts, graphs, models, and/or tables) are used ineffectively or inconsistently to analyze data. Statistical analysis is somewhat grade appropriate. Calculation tools such as graphical displays (maps, charts, graphs, models, and/or tables) are used inaccurately to analyze data. Statistical analysis is not grade appropriate. Skillfully evaluates the strength of scientific conclusions derived from the data set(s). Plausibly evaluates the strength of scientific conclusions derived from the data set(s). Attempts to evaluate the strength of scientific conclusions derived from the data set(s). Little or no attempt to evaluate the strength of scientific conclusions derived from the data set(s). Accurately uses mathematical arguments to describe and support conclusions. Sufficient use of mathematical arguments to describe and support conclusions. Minimal use of mathematical arguments to describe and support conclusions. Makes little use of mathematical arguments to describe and support conclusions. Correlations are identified accurately, and causation and correlation are clearly distinguished. Correlations are identified appropriately, and causation and correlation are adequately distinguished. Correlations are identified ineffectively, and causation and correlation are minimally distinguished. Correlations are identified inaccurately, and causation and correlation are minimal or missing. A Score of “0” indicates a blank or incoherent response


