Predator-Prey Graphing Activity: Limits in Growth
advertisement
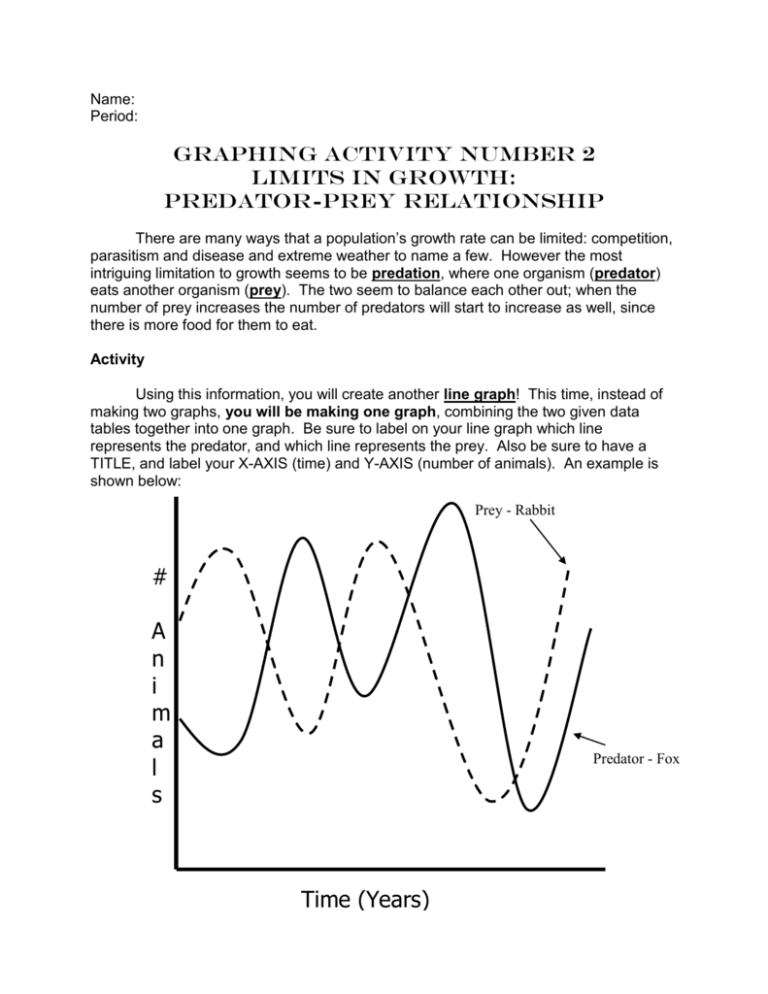
Name: Period: Graphing Activity Number 2 Limits in Growth: Predator-Prey Relationship There are many ways that a population’s growth rate can be limited: competition, parasitism and disease and extreme weather to name a few. However the most intriguing limitation to growth seems to be predation, where one organism (predator) eats another organism (prey). The two seem to balance each other out; when the number of prey increases the number of predators will start to increase as well, since there is more food for them to eat. Activity Using this information, you will create another line graph! This time, instead of making two graphs, you will be making one graph, combining the two given data tables together into one graph. Be sure to label on your line graph which line represents the predator, and which line represents the prey. Also be sure to have a TITLE, and label your X-AXIS (time) and Y-AXIS (number of animals). An example is shown below: Prey - Rabbit # A n i m a l s Predator - Fox Time (Years) Data Table 1: Foxes (Predator) Number Foxes Time (Years) 95 180 45 170 60 140 70 1900 1920 1940 1960 1980 2000 2020 Data Table 2: Rabbits (Prey) Number Rabbits Time (Years) 110 190 60 185 45 155 60 170 1890 1910 1930 1950 1970 1990 2000 2010 Remember: Each square on your graph paper has the same length! So your points that you put on your X and Y axes should have equal spacing (going up by 10, 20, 50, etc). DO NOT JUST USE THE POINTS IN THE DATA TABLE ON YOUR GRAPH. Post-Activity Questions: [answer on separate sheet of paper!] 1. In what year is the number of PREY the highest? How many prey are there? Approximately how many PREDATORS are there in that same year? 2. In what year is the number of PREDATORS the highest? How many predators are there? Approximately how many PREY are there in that same year? 3. Looking at your graph, describe what appears to be happening to the predator population after the number of prey begins to increase. Why does this happen? 4. Looking at your graph, describe what appears to be happening to the prey population after the number of predators begins to increase. Why does this happen? 5. How is this predator-prey relationship an example of limiting population growth for these organisms?


