Global Carbon Cycle Model
advertisement
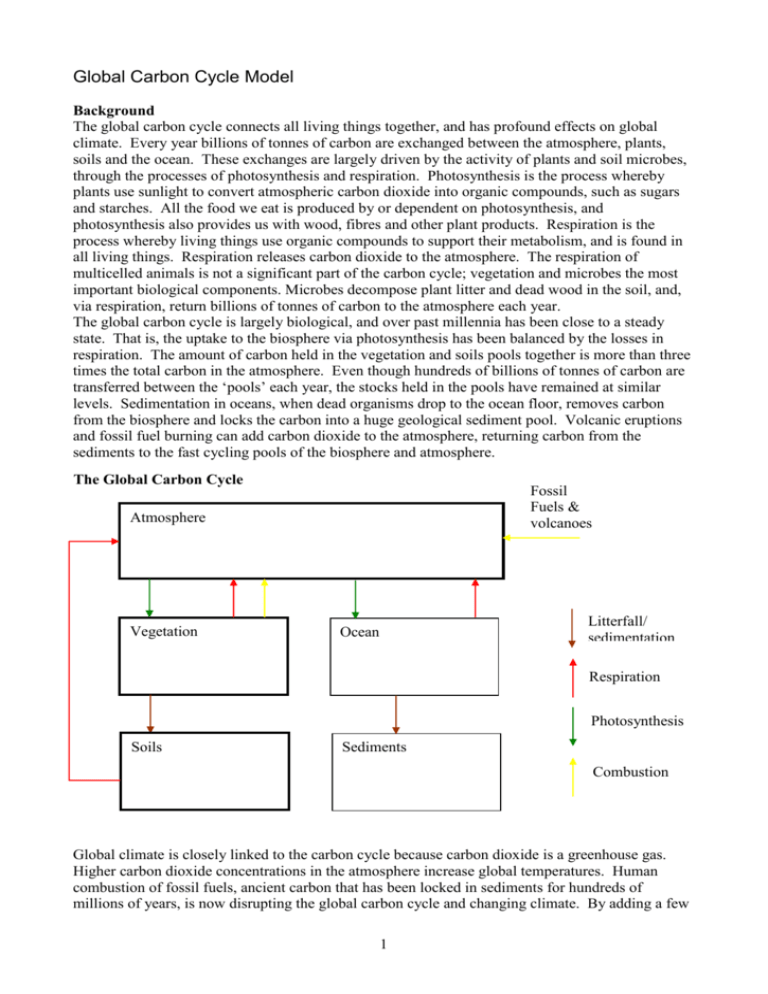
Global Carbon Cycle Model Background The global carbon cycle connects all living things together, and has profound effects on global climate. Every year billions of tonnes of carbon are exchanged between the atmosphere, plants, soils and the ocean. These exchanges are largely driven by the activity of plants and soil microbes, through the processes of photosynthesis and respiration. Photosynthesis is the process whereby plants use sunlight to convert atmospheric carbon dioxide into organic compounds, such as sugars and starches. All the food we eat is produced by or dependent on photosynthesis, and photosynthesis also provides us with wood, fibres and other plant products. Respiration is the process whereby living things use organic compounds to support their metabolism, and is found in all living things. Respiration releases carbon dioxide to the atmosphere. The respiration of multicelled animals is not a significant part of the carbon cycle; vegetation and microbes the most important biological components. Microbes decompose plant litter and dead wood in the soil, and, via respiration, return billions of tonnes of carbon to the atmosphere each year. The global carbon cycle is largely biological, and over past millennia has been close to a steady state. That is, the uptake to the biosphere via photosynthesis has been balanced by the losses in respiration. The amount of carbon held in the vegetation and soils pools together is more than three times the total carbon in the atmosphere. Even though hundreds of billions of tonnes of carbon are transferred between the ‘pools’ each year, the stocks held in the pools have remained at similar levels. Sedimentation in oceans, when dead organisms drop to the ocean floor, removes carbon from the biosphere and locks the carbon into a huge geological sediment pool. Volcanic eruptions and fossil fuel burning can add carbon dioxide to the atmosphere, returning carbon from the sediments to the fast cycling pools of the biosphere and atmosphere. The Global Carbon Cycle Fossil Fuels & volcanoes Atmosphere Vegetation Litterfall/ sedimentation Ocean Respiration Photosynthesis Soils Sediments Combustion Global climate is closely linked to the carbon cycle because carbon dioxide is a greenhouse gas. Higher carbon dioxide concentrations in the atmosphere increase global temperatures. Human combustion of fossil fuels, ancient carbon that has been locked in sediments for hundreds of millions of years, is now disrupting the global carbon cycle and changing climate. By adding a few 1 billions tonnes of carbon to the atmosphere each year the biosphere-atmosphere steady state has been broken. There are other, knock-on effects of the fossil fuel burning. Plants grow faster when there is more carbon dioxide in the atmosphere, as photosynthesis is fertilised. Microbes decompose organic matter more rapidly in warmer temperatures, so respiration is increased. We believe that the fertilization of photosynthesis is one reason why atmospheric carbon dioxide levels are not rising as fast as one would expect given the burning of fossil fuels. However, we are unsure whether this fertilization will continue or will weaken as plants become limited by other factors, such as drought or nutrients. Also, we do not know how sensitive soil microbes are to rising temperatures. There is considerable debate among ecologists on whether losses from the biosphere pools of carbon will one day exceed inputs (i.e. respiration will exceed photosynthesis). If and when this happens, the biosphere will act to accelerate the build-up of carbon dioxide in the atmosphere, rather than acting as a brake, as it currently does. Such a change in behaviour would be very dangerous for life on earth, as climate change would accelerate. The model We have constructed a model to explore the future of the global carbon cycle. The model is designed to make predictions over the next few decades only, and to provide qualitative outputs. The model is highly simplified and thus is designed as a learning tool, rather than a predictive aid. The model focuses only on the terrestrial biosphere and atmosphere and their interactions (the ocean and sediments are ignored) and this is reasonable given the short time scale of the model runs. The model determines the flows (‘fluxes’) of carbon among atmosphere, vegetation and soils via photosynthesis, respiration, burning of vegetation, and fossil fuel usage. The flux rates are controlled by various ‘parameters’ which are not well known. There are five parameters that the user can change. 1. Photosynthesis fertilization. Plants grow faster in an atmosphere with higher carbon dioxide levels, but this degree of fertilization is poorly known. We estimate that the rate of photosynthesis in early-industrial times (1870) was ~96 GT/ yr (a GT is a billion tonnes). This parameter can be changed to determine the maximum rate of photosynthesis in a world with very high atmospheric carbon dioxide levels. Our nominal value is 182 GT/yr – thus, we suggest that the fertilization effect could almost double photosynthesis. Try changing the parameter to 100, a very low fertlization effect, and then to 300, a very high value. 2. Soil respiration sensitivity. Microbes have been shown to respire more rapidly in warmer conditions as their metabolism increases. But the response is not well known and so it is hard to quantify. Our nominal value is 20, which means that respiration rates will double for a 10ºC rise in temperatures. A value of 0 will remove any temperature response; a value of 10 will mean that respiration rates will increase by 40% for a 10ºC rise in temperatures; a value of 32 will mean that respiration rates will triple for a 10ºC rise in temperatures. 3. Deforestation rate. Every year forests are cleared for agriculture and pasture, and the wood is often burned. This burning adds carbon dioxide to the atmosphere and reduces the size of the vegetation carbon pool. Current rates of deforestation are around 2GT/yr. Experiment with reducing the rate to zero, or increasing it to 5GT/yr. How these rates will change in the future depends on government policies for land use, particularly in the tropics. 4. Fossil fuel burning. Since the early industrial revolution society has largely been powered by burning fossil fuels. As the global economy has generally expanded year by year, so has fossil fuel use. For simplicity we have assumed that usage increases linearly (i.e. by a similar amount each year) and this parameter sets this rate of increase. Changes in this parameter indicate how different 2 rates of economic growth affect the carbon cycle and climate. Look at the fossil fuel graph to see how the parameter effects the rate of burning. 5. Policy cap. The Kyoto protocol is an international treaty aiming to restrict fossil fuel burning to fixed values. The policy cap parameter provides a means to explore how setting a maximum value to fossil fuel burning will translate into global impacts. Setting this parameter to 6 GT/yr would freeze fossil fuel use to current values. Once the parameters are set, click on the “run” button. You can then explore the various graph types. A. Temperature. This graph shows how average global temperatures will change in the future for the given parameter set. The global warming achieved by 2080 is indicated in the top right of the figure. A colour bar at the top of the figure indicates the impact severity – green (up to 2ºC warmer), amber (up to 3ºC warmer), and red (up to 5ºC warmer). Click on the coloured icons to seethe likely impacts for the UK and the globe with these levels of climate change. B. The carbon stocks graph shows the amount of carbon in atmosphere, soils and vegetation up to 2080. The rise in atmospheric carbon directly determines the temperature in A. C. The carbon flux graph shows how respiration and photosynthesis vary up to 2080. D. The net flux graph indicates the balance between photosynthesis and respiration. If positive, the biosphere is acting as a sink and is removing carbon from the atmosphere, slowing global warming. If negative, then the biosphere carbon store is shrinking and global warming is accelerated. E. The fossil fuel graph shows how much fossil fuel is released over the prediction period. 3
