TWO-WAY TABLES
advertisement
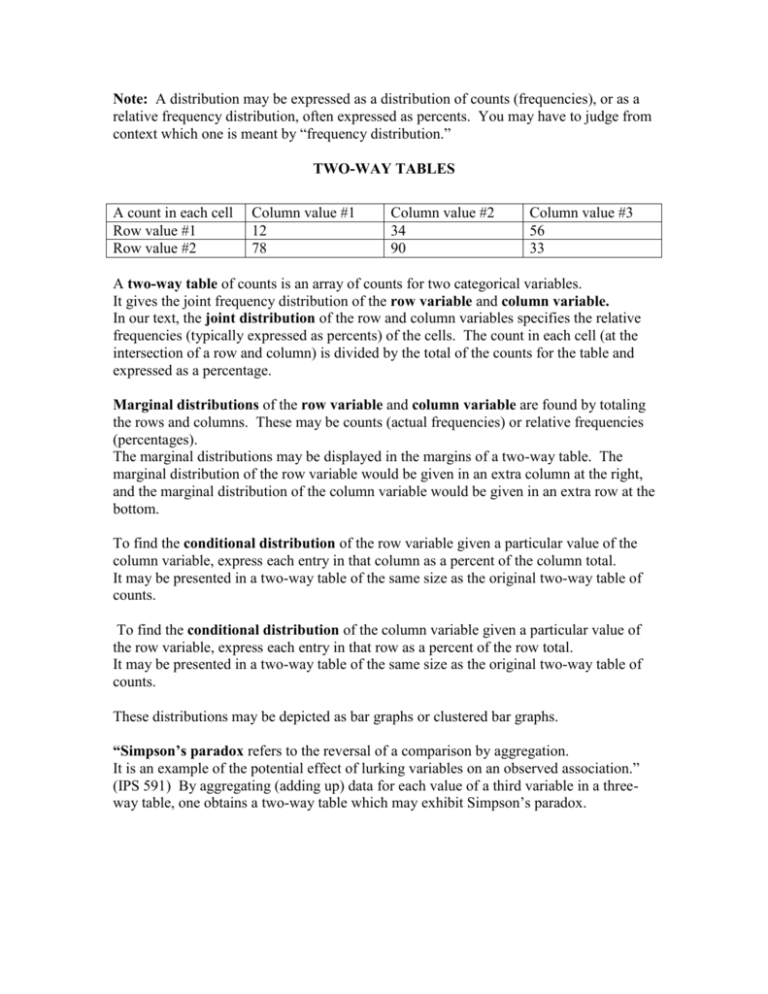
Note: A distribution may be expressed as a distribution of counts (frequencies), or as a relative frequency distribution, often expressed as percents. You may have to judge from context which one is meant by “frequency distribution.” TWO-WAY TABLES A count in each cell Row value #1 Row value #2 Column value #1 12 78 Column value #2 34 90 Column value #3 56 33 A two-way table of counts is an array of counts for two categorical variables. It gives the joint frequency distribution of the row variable and column variable. In our text, the joint distribution of the row and column variables specifies the relative frequencies (typically expressed as percents) of the cells. The count in each cell (at the intersection of a row and column) is divided by the total of the counts for the table and expressed as a percentage. Marginal distributions of the row variable and column variable are found by totaling the rows and columns. These may be counts (actual frequencies) or relative frequencies (percentages). The marginal distributions may be displayed in the margins of a two-way table. The marginal distribution of the row variable would be given in an extra column at the right, and the marginal distribution of the column variable would be given in an extra row at the bottom. To find the conditional distribution of the row variable given a particular value of the column variable, express each entry in that column as a percent of the column total. It may be presented in a two-way table of the same size as the original two-way table of counts. To find the conditional distribution of the column variable given a particular value of the row variable, express each entry in that row as a percent of the row total. It may be presented in a two-way table of the same size as the original two-way table of counts. These distributions may be depicted as bar graphs or clustered bar graphs. “Simpson’s paradox refers to the reversal of a comparison by aggregation. It is an example of the potential effect of lurking variables on an observed association.” (IPS 591) By aggregating (adding up) data for each value of a third variable in a threeway table, one obtains a two-way table which may exhibit Simpson’s paradox.

