Activities
advertisement

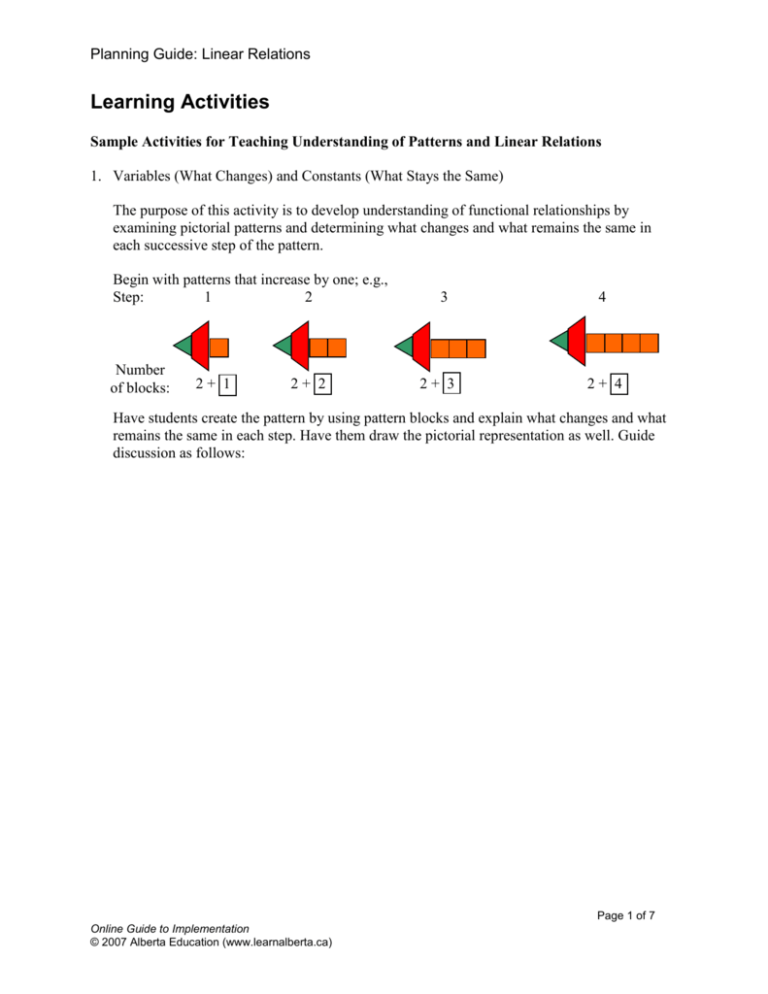
Planning Guide: Linear Relations Learning Activities Sample Activities for Teaching Understanding of Patterns and Linear Relations 1. Variables (What Changes) and Constants (What Stays the Same) The purpose of this activity is to develop understanding of functional relationships by examining pictorial patterns and determining what changes and what remains the same in each successive step of the pattern. Begin with patterns that increase by one; e.g., Step: 1 2 Number of blocks: 2+ 1 2+ 2 3 2+ 3 4 2+ 4 Have students create the pattern by using pattern blocks and explain what changes and what remains the same in each step. Have them draw the pictorial representation as well. Guide discussion as follows: Page 1 of 7 Online Guide to Implementation © 2007 Alberta Education (www.learnalberta.ca) Planning Guide: Linear Relations Since the one triangle and one trapezoid appear in each step, then these shapes remain the same and the number 2 can be written under the diagram in each step as shown above. This number is called the constant because it doesn't change with each succeeding step. Since one more square is added to each diagram for each step, then 1 can be added to 2 to show the total number of blocks for the first step, 2 added to 2 for the second step, 3 added to 2 for the third step and 4 added to 2 for the fourth step as shown above. Label the numbers that change in each step in some way; e.g., put a box around them as shown above. Review the meaning of a variable—a symbol that can stand for any one of a set of numbers or objects. Have students suggest a symbol to use for the variable in the pattern above and rewrite the addition expressions under each diagram, using the constant 2 and the variable they choose; e.g., 2 + n. Pose the following question: How can you use the expression 2 + n to find the total number of blocks in the 50th diagram? Explain your thinking. Guide the discussion to conclude that when you add 2 to the step number, you obtain the number of blocks for that step. Students may wish to write the linear relation as an equation; e.g., b = 2 + n, where b = the number of blocks in a diagram and n = the step number. Have students apply their understanding of linear relations in which the coefficient of n is 1 to another pattern where the coefficient of n is another counting number. Use another pattern with a different recursive relationship, such as the following, and discuss what changes and what stays the same in the different diagrams for the different steps. The pattern 2, 4, 6, 8 … can be represented as follows: Step: 1 Number of squares: 2 x 1 (or area of rectangle) 2 2x 2 3 2x 3 4 2x 4 In deciding what stays the same and what changes, guide the discussion to include the dimensions of the composite rectangle in each step; i.e., the width stays the same at 2 units but the length increases by 1 unit with each new step in the pattern. Page 2 of 7 Online Guide to Implementation © 2007 Alberta Education (www.learnalberta.ca) Planning Guide: Linear Relations Look For … Do students: examine the patterns to determine what stays the same and what changes in each successive step? apply their background knowledge of variables and use letters to represent the numbers that change in each step? use the recursive relationship to determine the functional relationship of a given linear relation? communicate why a linear relation represents a general rule in a given pattern? transfer their learning to other patterns? Have students write a linear relation to represent the pattern; e.g., A = 2n, where A equals the number of squares in each step and n represents the length of the rectangle or the number of squares in the bottom row of each step. Have students draw diagrams to show other similar patterns with the coefficient of the variable being 3 or 4; e.g., 3, 6, 9, 12, … 3n 4, 8, 12, 16, … 4n To guide students in writing linear relations with the coefficient of the variable greater than 1 and a constant added or subtracted, adjust the pattern with the rectangles as shown below. The pattern 3, 5, 7, 9, … can be represented as follows: Step: Number of squares: 1 2 1 2 2 2 +1 +1 3 4 2 3 +1 2 4 +1 Encourage students to use variables to write the linear relation; e.g., B = 2n + 1, where B = the number of blocks in a given step and n = the step number. Have students use the linear relation to find the number of blocks in the 50th step. Similarly, the pattern 1, 3, 5, 7, … can be represented as follows: Step: Number of squares: 1 2 1 –1 2 2 2 –1 3 23 –1 4 24 –1 Encourage students to use variables to write the linear relation; e.g., B = 2n – 1, where B = the number of blocks in a given step and n = the step number. Have students use the linear relation to find the number of blocks in the 50th step. Page 3 of 7 Online Guide to Implementation © 2007 Alberta Education (www.learnalberta.ca) Planning Guide: Linear Relations Consolidate the learning by having students examine the recursive relationships of a variety of patterns for linear relations to determine if the patterns increase by 1, 2, 3 and so on. Their explorations should lead them to conclude that a pattern that increases by 1 has the variable in the linear relation (functional relationship) with a coefficient of 1, a pattern that increases by 2 has the variable in the linear relation with a coefficient of 2 and so on. Once the coefficient of the variable is determined, then by substituting the step number for the variable it logically follows whether a constant must be added or subtracted to obtain the required number of elements for that step; e.g., Step Number 1 2 3 4 … 50 Number of Elements in the Step 7 9 11 13 … ? Guide the exploration and discussion as follows: Since the pattern (recursive relationship) in the bottom row of the chart increases by 2 each time, then the linear relation (functional relationship) for this pattern will have 2n included in it. Substituting 1 for n in the first step, you get 2 1 = 2. To get the required number of elements (7) for this first step, you must add 5. Therefore, the linear relation can be written as E = 2n + 5, where E is the number of elements in each step and n is the step number. The 50th step would have 2 50 + 5 = 105 elements. To conclude, review that the recursive relationships for patterns are needed to determine their functional relationships. It is the functional relationships written as linear relations that show the power of algebra, providing a general rule that can be Look For … used to find the number of elements in any step when Do students: given the step number. transfer the information in the problem to Have students discuss the similarities and differences another model, such as a between recursive and functional relationships, chart or diagram? recognizing that both are included in patterns but each of apply their them has a different role: understanding of A recursive relationship describes the pattern between recursive relationships successive numbers in one of the columns of a table of (how a pattern changes values. from step to step) to find A functional relationship is a general rule to describe a rule or a functional the relationship between two columns of numbers in a relationship (the table of values. relationship between two rows of numbers in a chart)? use the general rule (linear relation) to solve the problem, using larger numbers? Page 4 of 7 Online Guide to Implementation © 2007 Alberta Education (www.learnalberta.ca) Planning Guide: Linear Relations 2. Problem Solving with Patterns Provide students with problems, using everyday contexts in which they can apply their understanding of functional relationships; e.g., Patsy's Pizza Parlor has square tables that each seat 4 people. If you push 2 tables together, 6 people can be seated. If you push 3 tables together, 8 people can be seated. a) Write a general rule (linear relation) that can be used to calculate the number of people that can be seated given any number of tables put end-to-end. b) Use your general rule to find how many people can be seated if 50 tables are put endto-end. Build on students' knowledge of creating charts for patterns and have them suggest how the information in the problem can be represented in a chart. Encourage students to draw diagrams to represent the pattern and place the data in a chart; e.g., Number of Tables: Number of People: 1 4 2 3 6 8 Number of 1 2 3 4 … 50 Tables Number of 4 6 8 ? … ? People Have students describe the recursive relationship of the pattern of numbers in the bottom row of the chart; i.e., each succeeding number increases by 2. Build on students’ understanding of patterns in writing functional relationships that connect the step number with the number of elements in each step (see previous activity). Provide scaffolding for students if necessary by having them examine the diagrams in the pattern and notice what changes and what stays the same. Number of Tables: 1 2 3 2 1+2 2 2 +2 2 3 +2 Explain that the constant is 2 because 2 people sit at the ends in each diagram. Have students verbalize that the number of people seated on the sides that are not the ends of the table varies with each new step or table, i.e., for 1 table, 2 people can be seated at the sides that are not then ends; for 2 tables, 2 2 = 4 people can be seated at the sides that are not the ends; and for 3 tables, 2 3 = 6 people can be seated at the sides that are not the ends. See the expressions written below the diagrams. Page 5 of 7 Online Guide to Implementation © 2007 Alberta Education (www.learnalberta.ca) Planning Guide: Linear Relations Instruct students to write a linear relation, using a variable to represent the numbers in the boxes; e.g., 2n + 2 = P, where n is the number of tables placed end-to-end and P is the number of people. Have students use their linear relation to find the number of people that can be seated with 50 tables placed end-to-end by substituting 50 for n; e.g., 2 50 + 2 = 102. Have students write a sentence: When 50 tables are placed end-to-end, 102 people can be seated. Provide other real-world problems for students to write linear relations and use them to solve the problems. Remind them to use diagrams and charts to represent the problems so that they are better able to write the linear relations. 3. Contexts for Linear Relations Provide students with a linear relation and have them create a context to represent that relation; e.g., Given the linear relation, N 3N + 2 or D = 3N + 2, create a problem that could be solved using this linear relation. Use the think-aloud strategy to create a problem using this linear relation. Explain that translating the linear relation into a pattern in a chart helps to understand the meaning of the linear relation. Start the following chart by explaining that the step number or N is the label for the first row and the number of elements in the step or 3N + 2 is the label for the second row. This connects previous learning about creating charts to the present learning. Have students make suggestions as to what the numbers in the second row of the chart will be and justify their answers. Step Number (N) Number of Elements in the Step (3N + 2) 1 2 3 4 ? ? ? ? Look For … Do students: apply previous learning with patterns, using diagrams to create contexts for linear relations? create everyday problem-solving contexts for linear relations? check that the context created satisfies the linear relation provided? After students create the pattern in the second row, i.e., 5, 8, 11, 14 …, continue the think-aloud strategy. Explain that you will now have to think of an everyday context in which numbers increase by 3 each time, starting with 5. Pick a context that students can relate to; e.g., money. Suggest that money earned could increase so a problem could be created with money that would represent this linear relation. Example: You earn $5 the first day, $8 dollars the second day, $11 dollars the third day and so on. If this pattern continues, how much would you earn on the 20th day? Page 6 of 7 Online Guide to Implementation © 2007 Alberta Education (www.learnalberta.ca) Planning Guide: Linear Relations Have students suggest other everyday contexts that could be used to represent the given linear relation. Provide other linear relations and have students work in groups to find the pattern represented by the linear relations and create everyday contexts in problem form for them. Page 7 of 7 Online Guide to Implementation © 2007 Alberta Education (www.learnalberta.ca)


