Test 1 Review Answers to IB Practice Problems
advertisement
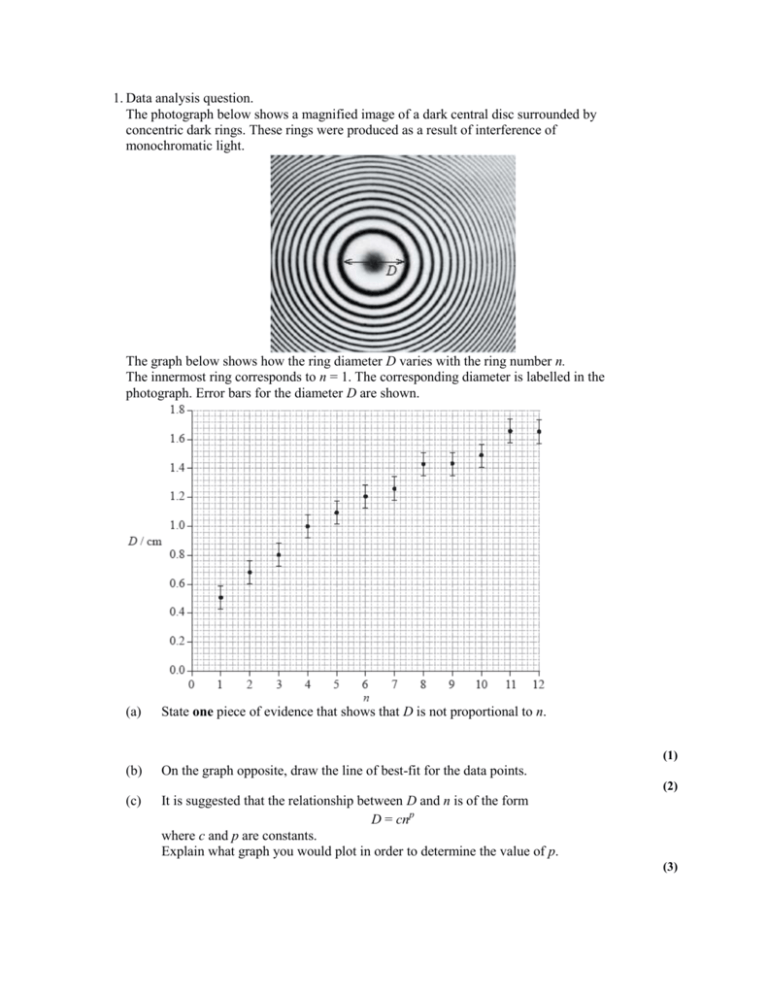
1. Data analysis question. The photograph below shows a magnified image of a dark central disc surrounded by concentric dark rings. These rings were produced as a result of interference of monochromatic light. The graph below shows how the ring diameter D varies with the ring number n. The innermost ring corresponds to n = 1. The corresponding diameter is labelled in the photograph. Error bars for the diameter D are shown. (a) State one piece of evidence that shows that D is not proportional to n. (b) On the graph opposite, draw the line of best-fit for the data points. (c) It is suggested that the relationship between D and n is of the form D = cnp where c and p are constants. Explain what graph you would plot in order to determine the value of p. (1) (2) (3) (d) 1 and so D2 = kn (where k = c2). 2 A graph of D2 against n is shown below. Error bars are shown for the first and last data points only. Theory suggests that p = (i) Using the first graph, calculate the percentage uncertainty in D2, of the ring n = 7. (ii) Based on the second graph, state one piece of evidence that supports the relationship D2 = kn. (iii) Use the second graph to determine the value of the constant k, as well as its uncertainty. (2) (1) (4) (iv) State the unit for the constant k. (1) (Total 14 marks) 2. Data analysis question At high pressures, a real gas does not behave as an ideal gas. For a certain range of pressures, it is suggested that the relation between the pressure P and volume V of one mole of the gas at constant temperature is given by the equation PV = A + BP where A and B are constants. In an experiment to measure the deviation of nitrogen gas from ideal gas behaviour, 1 mole of nitrogen gas was compressed at a constant temperature of 150 K. The volume V of the gas was measured for different values of the pressure P. A graph of the product PV of pressure and volume was plotted against the pressure P and is shown below. (Error bars showing the uncertainties in measurements are not shown). 13 12 PV / ×10 2 N m 11 10 0 5.0 10 15 20 P / ×106 Pa (a) Draw a line of best fit for the data points. (b) Use the graph to determine the values of the constants A and B in the equation PV = A + BP. Constant A (1) Constant B (5) (c) State the value of the constant B for an ideal gas. (d) The equation PV = A + BP is valid for pressures up to 6.0 × 10⁷ Pa. (i) Determine the value of PV for nitrogen gas at a pressure of 6.0 × 10⁷ Pa. (1) (2) (ii) Calculate the difference between the value of PV for an ideal gas and nitrogen gas when both are at a pressure of 6.0 × 10⁷ Pa. (2) (e) In the original experiment, the pressure P was measured to an accuracy of 5% and the volume V was measured to an accuracy of 2%. Determine the absolute error in the value of the constant A. (3) (Total 14 marks) 3. This question is about data analysis. Data for the refractive index n of a type of glass and wavelength λ of the light transmitted through the glass are shown below. Only the uncertainties in the values of n are significant and these uncertainties are shown by error bars. 1.6065 1.6060 1.6055 1.6050 1.6045 n 1.6040 1.6035 1.6030 1.6025 1.6020 1.6015 300 350 400 450 500 550 600 650 /nm (a) State why the data do not support the hypothesis that there is a linear relationship between refractive index and wavelength. (b) Draw a best-fit line for the data points. (c) The rate of change of refractive index D with wavelength is referred to as the dispersion. At any particular value of wavelength, D is defined by n D = Use the graph to determine the value of D at a wavelength of 380 nm. (d) It is suggested that the relationship between n and is of the form n = kp where k and p are constants. State and explain the graph that you would plot in order to determine the value of p. (1) (2) (4) (3) (e) A second suggestion is that the relationship between n and is of the form B n=A+ 2 where A and B are constants. 1 To test this suggestion, values of n are plotted against values of 2 . The resulting graph with the line of best fit is shown below. 1.6065 1.6060 1.6055 1.6050 1.6045 n 1.6040 1.6035 1.6030 1.6025 1.6020 1.6015 1.6010 0 0.1 0.2 0.3 0.4 0.5 1 2 (i) 0.6 0.7 0.8 0.9 1.0 1.1 1.2 / 10 -15 m-2 Use the graph to determine the value of the constant A. (3) (ii) State the significance of the constant A. (1) (Total 14 marks) 1. (a) (b) (c) (d) line of best fit is not straight / line of best fit does not go through origin; smooth curve; that does not go outside the error bars; Ignore extrapolations below n = 1. we can re-write the suggested relation as log D = log c + p log n; now we can plot a graph of log D versus log n; the slope of the (straight line) graph is equal to p; Accept logs in any base. (i) absolute uncertainty in diameter D is ±0.08cm; 0.08 giving a relative uncertainty in D2 of 2 × = 0.13 or 13%; 1.26 Award [2] if uncertainty is calculated for a different ring number. (ii) it is possible to draw a straight line that passes through the origin (and lies within the error bars); or D2 the ratio of is constant for all data points; n (iii) gradient = k; calculation of gradient to give 0.23 (accept answers in range 0.21 to 0.25); evidence for drawing or working with lines of maximum and minimum slope; answers in the form k = 0.23± 0.03; Accept an uncertainty in k in range 0.02 to 0.04. First marking point does not need to be explicit. (iv) cm2; 1 2 3 2 1 4 1 [14] 2. (a) (b) (c) (d) suitable straight-line of best fit; A is the intercept on the y-axis consistent with line drawn (or by implication); = 12.6 = 1.3 × 10³ Nm – the best fit line should give a 2 SD value of 1.3 × 10³ Nm; B is the gradient; some evidence that reasonable values have been used (y2 – y1 > 0.9, x2 – x1 > 8); = –1.0(0.1) × 10–5; Accept answers based on using two data points on line. Award [3 max] if points not on line. Ignore any missing units and do not penalize if minus sign is omitted. Award [1] for determination of B if only one data point is used. B = 0; (i) substitute into PV = A + BP PV = 1300 – (1.0 × 10–5 × 6.0 × 107); = 700(640 760)Nm; = 1.9(0.5) × 103 Nm if BP is added instead of subtracted. Award [1] for ecf. 1 5 1 2 (ii) (e) recognize that the ideal gas value is the intercept on the y-axis; or from PV = RT; or = constant A; difference 600(540 660) Nm; error bars constructed on two well separated points; attempt to draw reasonable extreme graph line / lines; reasonable estimate of uncertainty; Accept alternative approach. total% error for PV = 7%; 7% of 12.6 × 102 = 0.9 × 10²; so absolute error = (0.9) × 102 N m; 2 3 [14] 3. (a) (b) (c) (d) (e) a straight line / linear graph cannot be drawn that lies within all the error bars; smooth curve; that does not go outside error bars; recognize that Dλ is the gradient of the graph; suitable triangle ∆λ ≥ 100 nm; to give magnitude 1.15 – 1.40 × 10⁻⁵ nm–1 / 104 m–1; negative sign; lgn against lg; lgn = lg k + plgλ; slope/gradient = p; (i) recognize that A is the intercept on the n axis; line shown extrapolated; A = 1.6020 (±0.0001); Award full marks for correct answer with omission of first marking point award [2 max] if they find the gradient (B) and then use a data point to calculate A. (ii) it is the value of n / refractive index for an infinite wavelength / λ = infinity / minimum value of n; 1 2 4 3 3 1 [14]
