Spectrum Analyzer
advertisement

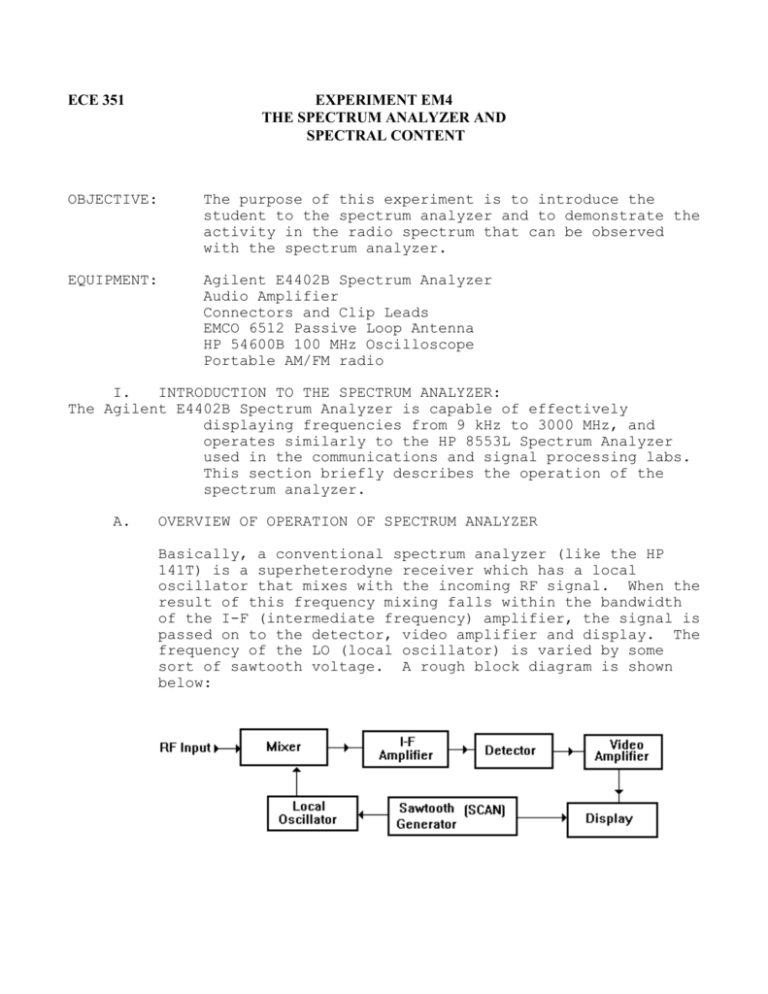
ECE 351 EXPERIMENT EM4 THE SPECTRUM ANALYZER AND SPECTRAL CONTENT OBJECTIVE: The purpose of this experiment is to introduce the student to the spectrum analyzer and to demonstrate the activity in the radio spectrum that can be observed with the spectrum analyzer. EQUIPMENT: Agilent E4402B Spectrum Analyzer Audio Amplifier Connectors and Clip Leads EMCO 6512 Passive Loop Antenna HP 54600B 100 MHz Oscilloscope Portable AM/FM radio I. INTRODUCTION TO THE SPECTRUM ANALYZER: The Agilent E4402B Spectrum Analyzer is capable of effectively displaying frequencies from 9 kHz to 3000 MHz, and operates similarly to the HP 8553L Spectrum Analyzer used in the communications and signal processing labs. This section briefly describes the operation of the spectrum analyzer. A. OVERVIEW OF OPERATION OF SPECTRUM ANALYZER Basically, a conventional spectrum analyzer (like the HP 141T) is a superheterodyne receiver which has a local oscillator that mixes with the incoming RF signal. When the result of this frequency mixing falls within the bandwidth of the I-F (intermediate frequency) amplifier, the signal is passed on to the detector, video amplifier and display. The frequency of the LO (local oscillator) is varied by some sort of sawtooth voltage. A rough block diagram is shown below: II. B. FREQUENCY SELECTION: At the top-left corner of the spectrum analyzer is the `FREQUENCY’ button. This button controls what frequency is CENTERED on the display. C. SCAN WIDTH PER DIVISION: The `SPAN’ button below the ‘Frequency’ button controls how much of the radio spectrum appears on the display. For example, if the ‘SPAN’ is set to 100 MHz, the display will show 50 MHz to the left and 50 MHz to the right of whatever frequency is set as the center frequency. D. BANDWIDTH The `BW/Avg’ (BW) button controls the pass band inside the spectrum analyzer, (i.e. the bandwidth of the intermediate frequency amplifier), and how much of a signal appears on the display. E SCAN TIME PER DIVISION: The `Sweep’ button controls how fast the spectrum analyzer sweeps the spectrum and determines how fast the trace sweeps across the display. AVOID scanning at fast speeds. OBSERVING SPECTRAL CONTENT: Turn on the spectrum analyzer, while following the cautions previously stated. A. Find the DC Marker using the following settings: CENTER FREQUENCY MHz (FREQUENCY button): 25 MHz SPAN (SPAN button): 100 MHz NOTES: (1) There is a marker to indicate the zero Hertz reference (DC) which will appear if the trace sweep is set to include 0 Hz. Any spectrum appearing to left of the DC marker is essentially a mirror image of the spectrum to the right of the marker. (2) Please DO NOT apply a DC signal to the spectrum analyzer because of the low input impedance. Also, please DO NOT apply an AC signal with more than 0.22 Vrms (0.3 V-pk) without padding the input. 2 Observe the DC marker appearing as a spike in the spectrum. The settings given above are initial settings only B. Record your settings: Center frequency, Span, Resolution bandwidth (under the BW/Avg button) and Video bandwidth (under the BW/Avg button). Observe the radio spectrum from 0 to 200 MHz: CENTER FREQUENCY MHz: 100 MHz SPAN: 200 MHz The DC line should appear at the left of your screen. Record your settings: Center frequency, Span, Resolution bandwidth (under the BW/Avg button) and Video bandwidth (under the BW/Avg button). 1. Connect a flexible wire antenna with the BNC connector to the `RF INPUT’ terminal of the Spectrum analyzer. You should see several signals displayed. With the center frequency at 100 MHz, change the SPAN to 6 MHz. Note that the BANDWIDTH and SCAN TIME are automatically selected by the spectrum analyzer. Use the marker button to note the frequency of the three most prominent signals. 2. Set the center frequency of the spectrum analyzer to one of the prominent signals recorded in step 2. Then set the span to approximately 136 Hz. Next, press the Det/Demod button and select the Demod option from the screen. Then select FM demodulation and make sure the speaker in the same menu is on. Increase the volume knob on the bottom right-had side of the spectrum analyzer until you hear the radio station. Audio should be heard on the speaker. * Record your settings: Center frequency, Span, Resolution bandwidth (under the BW/Avg button) and Video bandwidth (under the BW/Avg button). 3. Various antennas can be used to measure electric and magnetic fields over a wide frequency range. The loop antenna is most commonly used for the frequency range of 10 kHz - 30 MHz. Place the loop antenna on its stand, with the height at a 3 convenient level. Connect the cable from the loop antenna to the `RF INPUT’ terminal of the spectrum analyzer. Using the procedure outlined in above with a center frequency of 1 MHz and a span of 2 MHz, select one of the AM broadcast stations (0.55-1.6 MHz) using the marker button. Then select AM demodulation using the Det/Demod button. Listen to the signal to identify if the station is a music station or a talk news station. Record the station frequency (as measured on the spectrum analyzer). 4


