Roumanian Biotechnological Letters
Copyright © 2006 Bucharest University
Roumanian Society of Biological Sciences
Vol. 11, No. 2, 2006, pp. 2643-2648
Printed in Romania. All rights reserved
ORIGINAL PAPER
Characterization of some glycoside iridoids by mass spectrometry
Received for publication, 25 January, 2006
Accepted, 25 March, 2006
a
A. BLEOTU, bC. MANDRAVEL, cC. CIUCULESCU
Adrese_autori: a Process Engineering, intrarea Gadinti nr.3, sector2, Bucharest, Romania,
ancableotu@hotmail.com
b
University of Bucharest, Chemistry Faculty, Structure Department,64, M.Kogalniceanu
Street, Bucharest, Romania,
c
Romanian Academy Institute of Organic Chemistry, 202 B,Splaiul Independentei, Bucharest,
Romania,
Abstract
The compounds extracted from medicinal plants started to be investigated due to their use in the
treatments of different diseases. The studies of three iridoid compounds: harpagide, 8-O-acethyl
harpagide and harpagoside, by quadruple mass spectrometry suggested the general mechanism of
their fragmentation under electronic bombardment at 70 eV. The base peak obtained for all
compound fragmentations, it was those corresponding of substituent from C8, after the loose of
glucose ion.
Introduction
Plants have formed basis of sophisticated traditional medicine systems [1]. The
glycoside iridoids are known to be present only in the Dicotyledon Angiosperms within the
superorders Cornanae, Ericanae, Gentiananae, Lamianae and Loasanae. Plants extracts from
Stachys sieboldii Miq. containing glycosides iridoids were used as therapeutical products [2]
with multiple actions [3, 4]: vasoconstrictor, antiinflammatory activity and the induction of
immune response in the human body.
Around half of the drugs currently in clinical use are of natural product origin [5]. The
renaissance of natural products as drug candidates is supported on the synergy of the
compounds presented in the extracts and the pharmacological activities of the vegetable
extracts. In this work we continued the study [6] about the characterization by mass
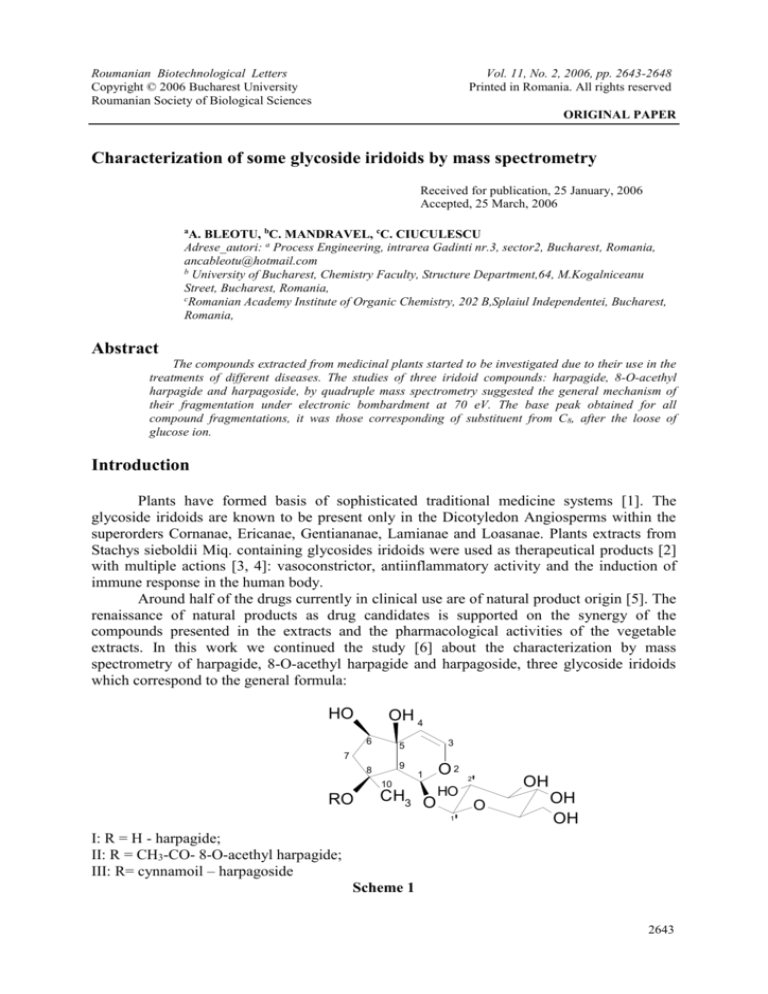
spectrometry of harpagide, 8-O-acethyl harpagide and harpagoside, three glycoside iridoids
which correspond to the general formula:
HO
OH 4
6
5
8
9
3
7
1
10
RO
CH3 O
O2
HO
2
'
O
1
'
OH
OH
OH
I: R = H - harpagide;
II: R = CH3-CO- 8-O-acethyl harpagide;
III: R= cynnamoil – harpagoside
Scheme 1
2643
A. BLEOTU, C. MANDRAVEL, C. CIUCULESCU
It is necessary to mention the very pertinent studies of Bentley and coworkers[7]
concerning cyclopentane monoterpenes of the iridoid group which not includes the presented
compounds.
Materials and methods
The studied iridoids were: harpagide (purity >99%), harpagoside (purity >95%), both
products of PhytoLab GmbH&Co.K.G and 8-O-acethyl harpagide, which was extracted and
purified in the Laboratory of Chemical Department of Technical University of Lyngby,
Denmark.
For the mass spectrometry study it was used a quadruple mass spectrometer QMD 1000 Carlo
Erba Instruments.
The solutions obtained from 10µg of the substance in 200 μl ethyl alcohol were introduced in
the vials and then in the mass spectrometer QMD 1000.
Working conditions:
- ionization energies 20eV and 70eV;
- detector voltage 350V;
- source temperature 1600C.
The temperature program used for obtaining the steam of compounds was the following:
during 2min. the temperature was maintained at 600C, then the temperature was increased at
5000C, using a temperature gradient 500C/min.
Results
The sensibility of mass spectrometer at 20 eV was lower than the sensibility at 70 eV,
but the spectra obtained at 20 eV were considered for better understanding of the complex
spectra at 70 eV, which are showed in the figures 1-3.
H3 583 (6.863)
Scan EI+
1.53e6
73
100
60
43
%
61
57
97
45
167
81
55
109
85
69
115
91
53
138
123 137
77
47
65
103
166
149
127
155
168
184
0
40
60
80
100
120
140
160
180
195
201 211
200
225
220
239 250
240
269 277
260
280
296 312 314
300
320
328 330 339
340
m/z
360
380
400
Figure 1. Mass spectrum of harpagide at 70 eV.
2644
Roum. Biotechnol. Lett., Vol. 11, No. 2, 2643-2648 (2006)
Characterization of some glycoside iridoids by mass spectrometry
H1 534 (6.727) Cm (419:555-(138:296+633:780))
100
Scan EI+
6.99e6
43
96
71
73
85
113
60
149
81
87
155
166
167
61
137
97
%
139
55
184
91
45
41
99
77
53
127
209
168
169
185
183
210
197
227 239
0
40
60
80
100
120
140
160
180
200
220
240
256 264 283 297
260
280
300
361 368
329
404 410 423
313 324
353
381383
439 442
m/z
320
340
360
380
400
420
440
Figure 2. Mass spectrum of 8-O- acethylharpagide at 70 eV
H4 593 (6.960) Cm (548:658-(302:461+703:895))
Scan EI+
2.42e6
147
100
73
148
77
103
131
60
91
71
%
43
51
61
97
57
45
149
85
166
69
137
39
113
65
121
167
138
81
155
165
168
184
185
0
40
60
80
100
120
140
160
180
191 209
200
223
220
239 251
240
260
268
293 297 311
280
300
320
329
346 357 370
340
360
386 398 400
380
400
416
m/z
420
Figure 3. Mass spectrum of harpagoside at 70 eV
Take into consideration these spectra, it was observed the following ion compositions,
presented in the tables 1-3.
Roum. Biotechnol. Lett., Vol. 11, No. 2, 2643-2648 (2006)
2645
A. BLEOTU, C. MANDRAVEL, C. CIUCULESCU
Table 1. Ion Composition obtained at harpagide fragmentation (C15H24O10)
m/e
77
103
CH
C6H5
C8H7
m/e
71
81
97
CHO
C4H7O
C5H5O
C6H9O
m/e
71
73
85
109
137
138
147
148
149
CHO2
C3H3O2
C3H5O2
C4H5O2
C6H5O2
C8H9O2
C8H10O2
C9H7O2
C9H8O2
C9H9O2
m/e
127
155
149
166
167
CHO3
C6H7O3
C8H11O3
C8H5O3
C9H10O3
C9H11O3
m/e
184
CHO4
C9H13O4
Table 2. Ion Composition obtained at 8-0-acethyl harpagide fragmentation (C17H26O11)
m/e
CH
m/e
CHO
77
C6H5
43
81
C8H9
m/e
CHO2
m/e
CHO3
m/e
CHO4
C2H3O 71
C3H3O2
139
184
69
C4H5O 96
C5H4O2
149
C9H12O
4
C10H13
O4
71
C4H7O 99
C5H7O2
155
81
C5H5O 110
C6H6O2
166
85
C5H9O 111
C6H7O2
167
95
C6H7O 127
C7H11O2
169
C7H7O
3
C8H5O
3
C8H11
O3
C9H10
O3
C9H11
O3
C9H13
O3
96
97
113
C6H8O 137
C6H9O
C7H13
O
C8H9O2
197
Table 3. Ion Composition obtained at harpagoside fragmentation (C24H30O11)
m/e
CH
m/e
CHO
m/e
CHO2
m/e
CHO3
m/e
CHO4
71
77
91
C5H11
C6H5
C7H7
71
81
97
121
131
C4H7O
C5H5O
C6H9O
C8H9O
C9H7O
43
71
73
85
137
147
148
149
C2H3O2
C3H3O2
C3H5O2
C4H5O2
C8H9O2
C9H7O2
C9H8O2
C9H9O2
103
149
155
165
166
167
C4H7O3
C8H5O3
C8H11O3
C9H9O3
C9H10O3
C9H11O3
155
184
C7H7O4
C9H12O4
2646
Roum. Biotechnol. Lett., Vol. 11, No. 2, 2643-2648 (2006)
Characterization of some glycoside iridoids by mass spectrometry
Discussions
From examination of 1-3 tables, the presence of the ion with m/e = 184 is very
evident. This ion corresponds to the aglycon after the loose of glucose radical. The most
intense peak with m/e=184 appeared in the spectrum of 8-O-acethyl harpagide. (see fig.2)
In the mass spectrum of harpagoside (fig.3), the base peak corresponds to cynnamoil
radical (m/e = 147).
Based on the mass spectra (fig.1-3) and the rigorous analysis of the data contained in
the tables 1-3, we proposed the following mechanism of harpagide fragmentation, in accord
with some considerations from work of T.W. Bentley et all [6].
O
OH
OH
OH
O -H2O
HO
+
O
HO
CH3
m/e 184
+
CH3
+
-CO
HO
CH3
m/e 138
m/e 166
-H2O
HO
HO
-H2O
O
CH3
+
+
m/e 85
O
m/e 81
+
CH3
-C
C
O
+
CH3
m/e 71
Schema 2. The mechanism of harpagide fragmentation
The similar mechanism was applied also in the case of 8-O-acethyl harpagide, with the
following observations:
-the mass of corresponding aglicon radical is m/e = 227;
Roum. Biotechnol. Lett., Vol. 11, No. 2, 2643-2648 (2006)
2647
A. BLEOTU, C. MANDRAVEL, C. CIUCULESCU
-the mass of acetyl radical was m/e 43;
-in the case of H2O molecule elimination from substitutes positioned at C5 and C6, it
was considered also the removal of acetyl radical, placed at C8;
-during the process of division appeared the break of bonds C3-O2, C5-C9 and C6-C7,
the acetyl radical can be eliminated from C8.
Further considering the analog mechanism of fragmentation for harpagoside, it was
proposed the following steps:
-the cinnamoyl radical with m/e=147 corresponded to base peak in the mass spectrum
(see fig.3). This radical has been eliminated first and it did lead to appearance of the fragment
with m/e=168. Although it was possible the loose of this one together with a H2O molecule
elimination
The molecular modeling calculations could complete these studies [8].
Conclusions
The ratios of obtained peaks by fragmentation in the mass spectra were variable from
compound to compound.
All the mass spectra of studied glycoside iridoids contained as base peak those
corresponding to the substitute from C8.
References
1. NEWMAN D.W., CREEGG G.M., SNADER K.M., Nat.Prod.Rep.,17, 215-234, (2000)
2. GHISALBERTI E.L., Phytomedicine, 5(2), 147-163, (1998)
3. KUONO I., KOYAMA I., JIANG Z. H., TANAKA T., YANG D.M., Phytochemistry, 40,
1567-1568, (1995)
4. CALIS I., YUMCHER A., RUEGGER H., WRIGHT A.D., STICHERS O.,
Phytochemistry, 38(1), 163-165, (1995)
5. PATTERSON I., ANDERSON E.A., Science 310, 451-453, 2005
6. MANDRAVEL C., STANESCU U., BLEOTU A., MIRON A., Proc.25th ARA
Congr.Cleveland Ohio, USA, July 12-16, 349-352, (2000)
7. BENTLEY T.W., JOHNSTONE R.A., J.Chem.Soc. (C), 2234-2240, (1967)
8. BLEOTU A., STANCULESCU I., MANDRAVEL C., Proc.RICCCE XIV, 2, 35-37,
(2005)
2648
Roum. Biotechnol. Lett., Vol. 11, No. 2, 2643-2648 (2006)

