Chromatographic Separations Basics
advertisement
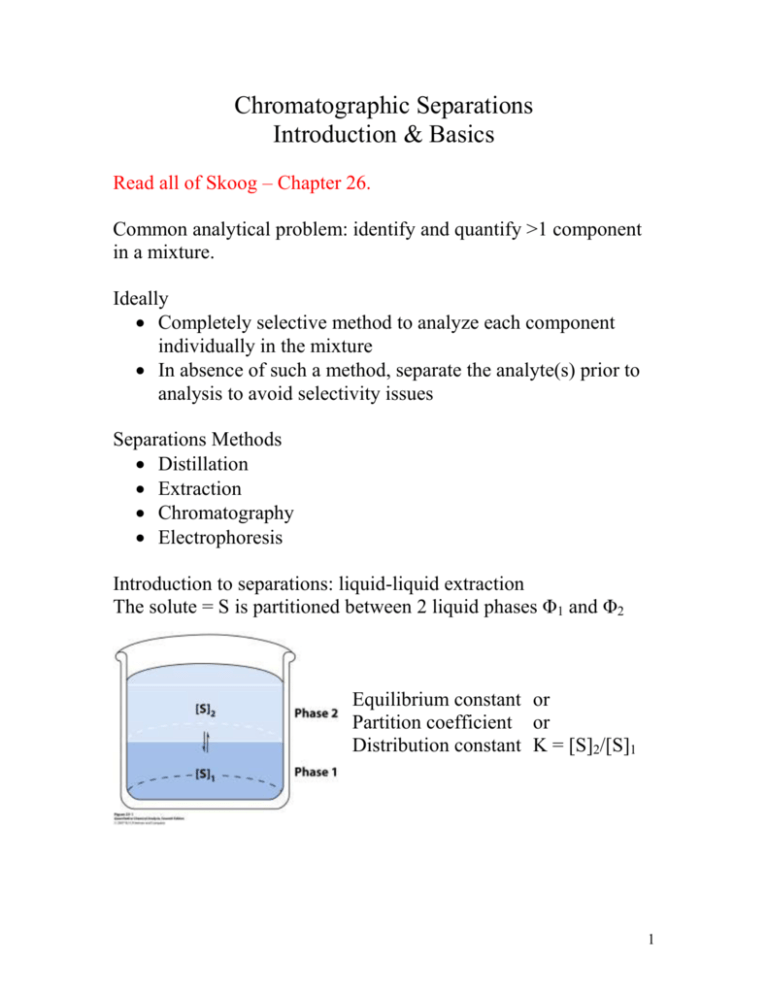
Chromatographic Separations Introduction & Basics Read all of Skoog – Chapter 26. Common analytical problem: identify and quantify >1 component in a mixture. Ideally Completely selective method to analyze each component individually in the mixture In absence of such a method, separate the analyte(s) prior to analysis to avoid selectivity issues Separations Methods Distillation Extraction Chromatography Electrophoresis Introduction to separations: liquid-liquid extraction The solute = S is partitioned between 2 liquid phases Φ1 and Φ2 Equilibrium constant or Partition coefficient or Distribution constant K = [S]2/[S]1 1 So what gives a better separation of solute between the 2 phases – 1 large extraction or several small ones? Solute A has K = 3 between toluene and water ([A] in toluene = 3x [A] in water). Start with 100 mL of 0.01 M aqueous solution of A and extract with toluene. Which procedure gives a better extraction: a) 1 extraction with 500 mL toluene or b) 5 extractions with 100 mL toluene/extraction 2 The more equilibria a mixture attains between 2 different phases the greater the separation. Instrumental separations methods (i.e. chromatography) designed to give the maximum number of equilibria (theoretical plates). Chromatography operates on the same principle as extraction, but one phase is held in place (stationary phase) while the other moves past it (mobile phase). The interaction of the solute with the stationary phase to a large extent dictates the distribution constant K. The nature of this interaction is one way to generally categorize chromatographic methods. For a solute A: K = [A]stat Φ/[A]mobile Φ 3 The basics remain the same regardless of the type of interaction dictating the distribution constant. Note that your text in Table 26-1 also categorizes chromatographic methods by the type of mobile phase: GC = gas chromatography, gaseous mobile phase LC = liquid chromatography, liquid mobile phase SFC = supercritical fluid chromatography, supercritical fluid mobile phase Below, 2 substances A and B are shown eluting down a column packed with stationary phase. Mobile phase is continuously added such that elution continues until the substances are eluted from the end of the column. If K = [A]stat Φ/[A]mobile Φ Then K for solute A < K for solute B As solute partitions between the stationary phase and fresh mobile phase, bands from the 2 solutes begin to separate from one another as a result of successive equilibria between mobile and stationary phase Each equilibrium achieved between mobile and stationary phase is a theoretical plate (holdover terminology from distillation theory) 4 Since solute movement can occur only in the mobile phase, the average rate at which a solute migrates down the column depends on the fraction of time it spends in the mobile phase, dictated by K for that solute A chromatogram is a graph of detector response as a function of elution time 2 factors affect column performance (separations) 1. As solutes elute down the column, band separation occurs due to successive equilibria between phases (differences in migration rates – good to maximize) 2. As solutes elute down the column, each solute band inevitably broadens – good to minimize Band (Zone) separation – An equilibrium treatment (Ch. 26 Section B) The partition or distribution constant (K) is not readily measured, but the retention time is, and it is directly related to K. 5 Definitions: tM tR tR ’ retention or capacity factor k or k’ = α (selectivity factor) If: Solute is in mobile phase all the time Solute is in mobile phase 50% of the time and in stationary phase 50% of the time Solute is in mobile phase 25% of the time and in stationary phase 75% of the time 6 If the solute spends 3x as much time in the stationary phase as the mobile phase, then 3x as many moles of solute are in the stationary phase compared to the mobile phase. If k’ < 1 then the solute elutes too quickly, near tM If k’ > 20 then tR is too long causing various problems Ideally k’ between 1 and 10, separation conditions are adjusted to make that happen (discussed in Ch 26, Section D) Now the last definition: selectivity factor. The point of chromatography is to effect a separation, which is fundamentally based on differences in partition coefficients between solutes. α = KA/KB = selectivity factor (α > 1 by definition) 7 Two factors contribute to how well compounds are separated: 1. Difference in elution times between peaks: (already) explained by equilibrium theory. Larger difference in K, the better the separation. 2. The wider the peaks, the poorer the separation. Now to be treated by rate theory. Band broadening and column efficiency: Rate theory Section 26C Chromatography peaks are Gaussian. Overall uncertainty = ∑ many random uncertainties Most common result = mean Width defined by standard deviation In previous section we looked at the average result (mean = tR) In this section better to think at the molecular level and remember… A solute can only move down the column while in the mobile phase A single solute molecule may get “hung up” in the stationary phase and lag behind, Or A single solute molecule may spend an inordinate amount of time in the mobile phase and race ahead. The result: band broadening. 8 Early on chromatography and band spreading was treated as an equilibrium process using distillation theory. Terminology, which can cause confusion, unfortunately remains. Theoretical Plate – where a solute undergoes equilibrium between mobile and stationary phase. Number of theoretical plates = N Plate Height = H If N = L/H and H = s2/L 9 w2 = 16s2; s2 = w2/16 At a given mobile phase flow rate L is proportional to tR for a given solute so: A solute with a retention time of 407s has a width at the base of 13s, on a 12.2m long column. Find N and H. Column separation efficiency increases as N increases, and increases as H decreases. Compare N and H only for the same compound. Chromatography: N = 100 – 10,000 H = 0.1 – 0.001 cm Capillary electrophoresis: N ~ 106 H ~ 10-3 cm So far, column efficiency discussed by plate or equilibrium theory, which cannot explain the following experimental data: 10 The above van Deemter plot shows that there is an optimum flow rate, and that plate height is very much a function of mobile phase flow velocity. What are the mechanisms for zone broadening? H = A + B/u + Cu van Deemter equation The multipath (A) term 11 The longitudinal diffusion (B/u) term Mobile and stationary phase mass transfer (Cu) term Breaking the van Deemter plot into individual contributors: 12 Comparison of van Deemter plots for gas chromatography (GC) and liquid chromatography (LC) At low flow rates plate height decreases with increasing flow rates from longitudinal diffusion term. Larger effect in GC For same reason plate heights smaller in LC than GC. The multipath A term: 13 A = 0 for no packing (common in GC, not LC) Summary Addressed migration rates and distribution constants (26B) Addressed zone broadening (26C) Now – optimization of column performance (26D) by either Altering relative migration rates, or reducing zone broadening The goal is to resolve 2 or more solutes in a mixture – dependent on differences in retention time and zone width. Resolution Rs = ΔtR/Wav 14 A little algebra to derive relationships relating resolution, retention times (i.e. retention and selectivity factors), and zone broadening (i.e. theoretical plates). 15 Note that the above equation can be rearranged to find N for a desired resolution: In practical terms, resolution is only important when KA≈KB Example 26-1 on p. 777 reviews many concepts. The fundamental parameters of selectivity (α), retention factor (k) and theoretical plates (N,H) can all be varied to achieve a separation. Selectivity: Theoretical Plates/Plate Height: Retention factor: easiest way to improve resolution 16 A more general discussion… Gradient Elution in liquid chromatography – a systematic variation of mobile phase composition to optimize k for a wide range of solutes. Temperature programming in gas chromatography – a systematic variation of temperature to optimize k for a wide range of solutes. 17 General applications of chromatography (Section 26F) Qualitative analysis tR only qualitative information. No structural information. Strong indicator of presence of analyte, unequivocal proof of analyte absence. Useful for separation prior to acquiring structural information using another technique which would not be useful for a mixture. Quantitative analysis Peak areas Reproducible injection volumes (calibrations) End of Chapter 26 questions/problems: 1-3, 6-15, 17-19, 21 18

