Year 4 Mathematics
advertisement
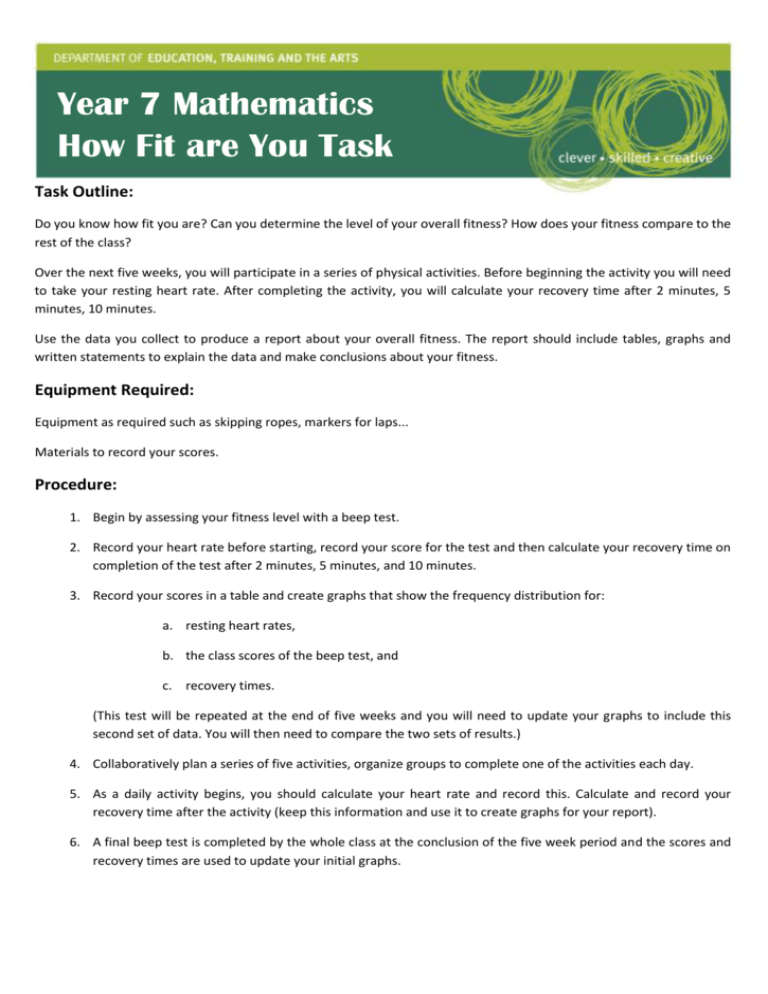
Year 7 Mathematics How Fit are You Task Task Outline: Do you know how fit you are? Can you determine the level of your overall fitness? How does your fitness compare to the rest of the class? Over the next five weeks, you will participate in a series of physical activities. Before beginning the activity you will need to take your resting heart rate. After completing the activity, you will calculate your recovery time after 2 minutes, 5 minutes, 10 minutes. Use the data you collect to produce a report about your overall fitness. The report should include tables, graphs and written statements to explain the data and make conclusions about your fitness. Equipment Required: Equipment as required such as skipping ropes, markers for laps... Materials to record your scores. Procedure: 1. Begin by assessing your fitness level with a beep test. 2. Record your heart rate before starting, record your score for the test and then calculate your recovery time on completion of the test after 2 minutes, 5 minutes, and 10 minutes. 3. Record your scores in a table and create graphs that show the frequency distribution for: a. resting heart rates, b. the class scores of the beep test, and c. recovery times. (This test will be repeated at the end of five weeks and you will need to update your graphs to include this second set of data. You will then need to compare the two sets of results.) 4. Collaboratively plan a series of five activities, organize groups to complete one of the activities each day. 5. As a daily activity begins, you should calculate your heart rate and record this. Calculate and record your recovery time after the activity (keep this information and use it to create graphs for your report). 6. A final beep test is completed by the whole class at the conclusion of the five week period and the scores and recovery times are used to update your initial graphs. 7. At the end of the five weeks, you will need to produce a written report containing tables and appropriate graphs with statements about your fitness. You should use as much mathematical language as possible to justify your statements and conclusions. Your written report of personal fitness should include: An initial assessment of personal fitness with data describing resting heart rate and recovery time. A description of the activities to be completed each day/week. A collaboratively produced graph showing the range of scores of resting heart rates. The graph should illustrate the scores obtained at the beginning of the task as well as the scores obtained after the 5 weeks of activity. The mean, median and mode for each set of results should be shown on the graph. A collaboratively produced graph showing the range of scores on a beep test. The graph should illustrate the scores obtained at the beginning of the task as well as the scores obtained after the 5 weeks of activity. The mean, median and mode for each set of results should be shown on the graph. A graph showing the range of your recovery times after each beep test. The mean, median and mode should be shown on the graph. Tables showing your heart rate before and after the activity and recovery times required. A graph showing heart rates and recovery times for each activity. A written report analysing data from the weekly tables and graphs to make generalizations about o changes to your personal fitness, and o how your personal fitness compares to the class. A concluding statement that includes a reflection on using mathematical data, tables and graphs to record personal fitness levels and how effective this has been in raising personal awareness of fitness. Year 7 Mathematics – How Fit am I? Task Assessable Elements Calculate mean median and Knowledge and mode and create a frequency Understanding Communicating Reflecting B C Consistently and accurately completes calculations of mean, median and mode and accurately creates a frequency distribution chart from class data. Calculations of mean, median and mode are mostly correct and frequency distribution chart is completed to a satisfactory standard. Draw tables and graphs to represent data in order to make comparisons Creates detailed tables and graphs to represent and compare heart rates and recovery time Creates a basic table showing comparative scores for heart rate and recovery time. Select and use suitable mental and written computations, estimations, representations and technologies to generate solutions and to check for reasonableness Confidently and accurately selects and applies computation methods to calculate mean, median and mode and checks for reasonableness of solutions. Selects and applies appropriate computation methods to calculate mean, median and mode. Makes a basic attempt to check solutions. Evaluate thinking and reasoning to determine whether mathematical ideas, strategies and procedures have been applied effectively Comprehensively explains the most effective measure of location (mean, median or mode) to use in order to make comparisons and draw conclusions from the data. Provides a sound explanation to compare the data using one of the measures of location (mean, median or mode). Communicate thinking and justify reasoning and generalizations, using mathematical language, representations and technologies Comprehensively applies mathematical reasoning to explain overall personal fitness level. “My overall personal fitness is Provides a sound explanation using some mathematical language and representations. “My score was higher above average. This is because my scores compared to the class mean….”(Explanation draws on several mathematical features to make generalizations) than the class mean so I am fairly fit.” Reflect on and identify the contribution of mathematics to their life Comprehensively relates awareness of overall personal fitness to mathematical calculations and comparative data i.e. “At Makes a sound statement to reflect on the link between mathematics and overall personal fitness i.e.”Doing all the first I thought I was fairly fit, but as I began collecting data and comparing my scores to the class using mathematics, I began to realise that I was actually in the lower range and that made me really work harder to try and improve my fitness.” maths was good, because it really showed how fit I was.” distribution diagram Thinking and Reasoning Descriptors A D E

