Supporting Material_rev1
advertisement
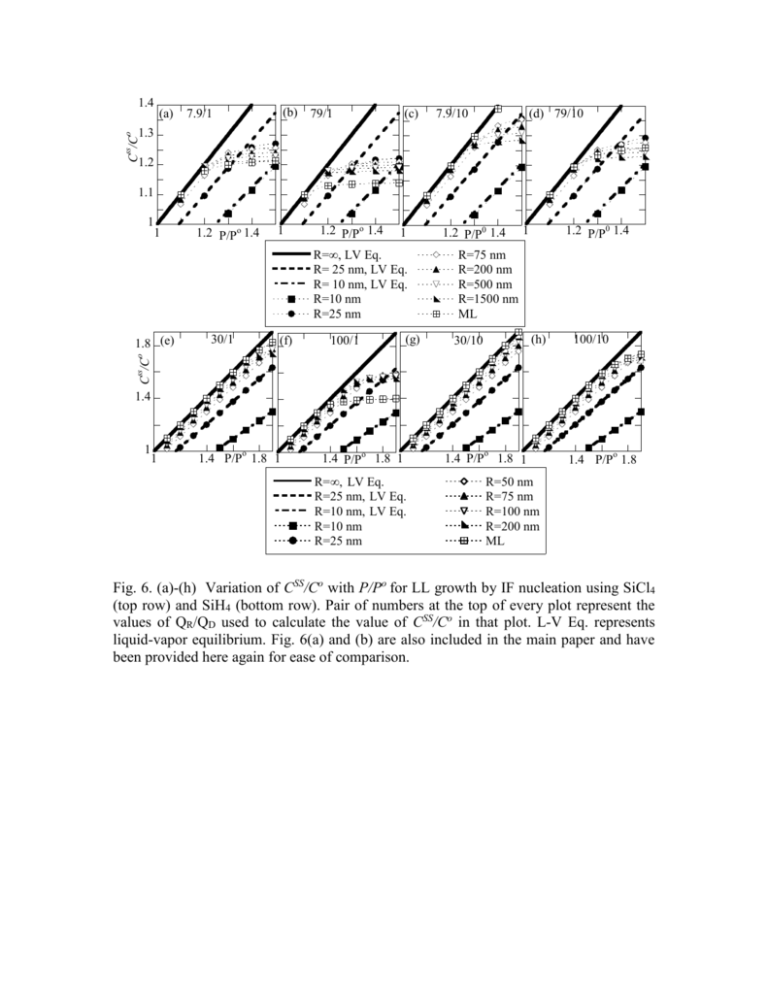
(a) (b) 79/1 7.9/1 (c) 7.9/10 (d) 79/10 1.3 ss C /C o 1.4 1.2 1.1 1 1 1.2 P/Po 1.4 1 1.2 P/Po 1.4 1 R=LV Eq. R= 25 nmLV Eq. R= 10 nmLV Eq. R=10 nm R=25 nm 30/1 (f) 100/1 (g) 1 1.2 P/P0 1.4 R=75 nm R=200 nm R=500 nm R=1500 nm ML (h) 30/10 100/10 ss C /C o 1.8 (e) 1.2 P/P0 1.4 1.4 1 1 o 1.4 P/P 1.8 1 1.4 P/Po 1.8 1 R= LV Eq. R=25 nmLV Eq. R=10 nmLV Eq. R=10 nm R=25 nm 1.4 P/P o 1.8 1 o 1.4 P/P 1.8 R=50 nm R=75 nm R=100 nm R=200 nm ML Fig. 6. (a)-(h) Variation of CSS/Co with P/Po for LL growth by IF nucleation using SiCl4 (top row) and SiH4 (bottom row). Pair of numbers at the top of every plot represent the values of QR/QD used to calculate the value of CSS/Co in that plot. L-V Eq. represents liquid-vapor equilibrium. Fig. 6(a) and (b) are also included in the main paper and have been provided here again for ease of comparison. (i) 7.9/1 (TPB) (j) 79/1 (TPB) (k) (l) 79/10 (TPB) 7.9/10 (TPB) ss C /C 0 1.4 1 1 1.2 P/P0 1.4 o 1 1.2 P/P 1.4 1 1.2 P/Po 1.4 R=10 nm R=25 nm R=75 nm R=LV Eq. R=25 nmLV Eq. R=10 nmLV Eq. 30/1 (TPB) (n) 100/1 (TPB) (o) 30/10 (TPB) R=200 nm R=500 nm R=1500 nm (p) 100/10 (TPB) ss C /C o 1.8 (m) 1.2 P/Po 1.4 1 1.4 1 1 o 1.4 P/P 1.8 1 1.4 P/Po 1.8 1 1.4 P/Po 1.8 1 1.4 P/Po 1.8 R= LV Eq. R=10 nm R=75 nm R=25 nmLV Eq. R=25 nm R= 100 nm R=10 nmLV Eq. R=50 nm R=200 nm Fig. 6. (i)-(p) Variation of CSS/Co with P/Po for LL growth by TPB nucleation using SiCl4 (top row) and SiH4 (bottom row). Pair of numbers at the top of every plot represent the values of QR/QD used to calculate the value of CSS/Co in that plot. L-V Eq. represents liquid-vapor equilibrium. 30/1 100/1 (e) (f) 30/10 100/10 (g) (h) ss C /C o 2 1.5 1 0 0 100 200 R (nm) 7.9/1 (i) 100 200 0 R (nm) 7.9/10 (k) 100 200 R (nm) 79/10 (l) 600 1200 R (nm) 600 1200 R (nm) ss C /C 0 1.4 100 200 0 R (nm) 79/1 (j) 1.2 1 0 600 1200 R (nm) 0 100 200 R (nm) 100/1 0 30/10 (n) 0 100/10 (o) (p) ss C /C 0 2 0 600 1200 R (nm) 30/1 (m) 1.5 1 0 100 200 R (nm) 0 100 200 R (nm) 0 100 200 R (nm) Fig. 7. Variation of CSS/Co with wire radius R. (a)-(d) In main body of manuscript. (e)-(h) LL growth by SiH4 and interface nucleation and ML growth. (i)-(l) LL growth by TPB nucleation using SiCl4 at 1000C. (m)-(p) LL growth by SiH4 at 480C. The CSS/Co values were calculated from the equality representing the steady state, Eq. 30, by using a Matlab code. In all rows, the solid symbols are for growth by the radius independent ML mode. The solid lines give the transition radius calculated using Eq. 25. Pair of numbers at the top of every figure give the combination of QR and QD used to calculate the data in that figure. Symbols o, □, ◊, ∆, and are for P/Po = 1.1, 1.2, 1.3, 1.4 and 1.5 respectively in the middle row and P/Po= 1.1, 1.3, 1.5, 1.7 and 1.9 in the top and bottom rows. The solid symbols represent growth rate using the ML mode. Growht Rate (nm/sec) 30 30/1 (e) 0.003 20 0.002 10 0.001 100/1 0.03 30/10 (g) 0.0008 100/10 (h) 0.02 0.0004 0 0 0.01 0 0 100 200 R (nm) 1.1 LL 1.6 LL Growth Rate (nm/sec) (f) 600 7.9/1 (TPB) (i) 0.8 100 200 R (nm) 0 0 1.7 LL 1.8 LL 1.9 LL 1.1 ML 79/1 (TPB) (j) 0.6 400 200 0 0 100 200 R(nm) 1.6 ML 1.7 ML 7.9/10 (TPB) (k) 100 200 0 0 600 1200 R (nm) Growht Rate (nm/sec) 1.1 LL 1.2 LL 30/1 (TPB) 4 (m) 0.002 2 79/10 (TPB) 0.6 (l) 0.2 0.2 600 1200 R (nm) 1.8 ML 1.9 ML 0.4 0.4 0 0 100 200 R (nm) 0 0 1.3 LL 1.4 LL 0 0 600 1200 R (nm) 1.5 LL 1.1 ML 100/1 (TPB) (n) 0.002 600 1200 R (nm) 1.2 ML 1.3 ML 30/10 TPB (o) 1.4 ML 1.5 ML 0.0008 100/10 (TPB) (p) 0.0006 0.001 0.001 0.0004 0.0002 0 0 100 200 R (nm) 0 0 1.1 LL 1.6 LL 100 200 R (nm) 1.7 LL 1.8 LL 0 0 1.9 LL 1.1 ML 100 200 R (nm) 1.6 ML 1.7 ML 0 0 100 200 R (nm) 1.8 ML 1.9 ML Fig. 8. Variation of growth rate Radius R . (a)-(d) In main body of manuscript. (e)-(h) LL growth by IF nucleation using SiH4. (i)-(l) LL growth by TPB nucleation using SiCl4. (m)-(p) LL growth by TPB nucleation using SiH4. Pairs of numbers at the top of each graph represents the combination of QR and QD used to calculate the growth rates. Solid symbols represent the growth rates due to the radius independent ML mode. S. 1: Calculated growth rates for TPB nucleation by SiCl4(middle row in Fig. 8 above) and IF and TPB nucleation using SiH4 (top and bottom rows in Fig. 8 above): 1. The trends in the calculated growth rates for LL mode by TPB nucleation for SiCl4 are the same as that for LL mode by IF nucleation in the main body of the text. 2. As in the case of growth using SiCl4, experimental data of growth from SiH4 displays a rising trend with R up to up to about 30 nm and then saturates to a constant value.14 Typical growth rates are about 2-3 nm/sec. In good agreement with these experimental trends, in three of the calculated plots 8(e), (g) and (h), the same observation is made, that is an initial increase followed by a saturation Figure 8(e) or decrease Figure 8(g) and (h). Such a decrease in growth rates at large radii has been experimentally observed6 for growth by SiCl4, by some groups. Reasons for the same have been discussed in the paper in the section on “Wire growth rates.” 3. In one of the data sets, Figure 8(j) the growth rate has not saturated or reached its maximum. While this might seem as an anomaly, it really is not. Even in the case of SiCl4 the non-saturating behavior as mentioned is present but not easily visible because of the scale used. This particular data set therefore brings out the fact that the rise and saturation behavior observed is not a general feature of the set of equations representing the steady state kinetics of LL growth, but occurs when the right combination of activation parameters and supersaturation are present. S.2: Reconciling the radius dependence of the growth mechanism and the experimentally observed radius independent growth rate: The experimental observation of a radius independent growth rate in spite of LL mode growth can only be possible if and only if the nucleation rate (frequency per unit area) J, eq 18, itself decreases with an increase in R, to compensate for the larger area available for nucleation. As can be seen from eq 18 this is possible only if C and hence the chemical potential of Si in the droplet decreases with an increase in R. Indeed as seen from eqs 4, 5, 15, 16(a) and 18 we get, for the steady state condition at constant pressure, K8 R 2 (C / C o ) ln( C / C o ) 1/ 2 K9 exp o ln( C / C ) (S1) using equations representing IF nucleation. In deriving eq S1, the second term in eq 1 has been neglected based on the justification given previously. A similar analysis can be performed for TPB nucleation. K8 and K9 are constants that can be evaluated from the respective equations and do not have any radius or concentration dependence. For the range of C/Co involved for the AuSi system, 1 to 5, the change in the non-exponential term is negligible compared to that of the exponential one. Hence, if the logarithmic and linear dependence on C/Co is neglected (and incorporated into K8) with respect to the exponential dependence on the RHS of eq S1 then we get K9 K9 1 2 or ln( C / C o ) exp o ln( R 2 / K 8 ) ln( C / C ) R (S2) eq S2 shows that as the radius increases the concentration C and hence chemical potential of Si in the droplet should decrease under these conditions as required by the observed radius independence of the growth rate. Substituting eq S2 back in eq 18 (main text), it can be easily verified that the nucleation rate varies as 1/R 2 and hence the growth rate, eq 26a as required becomes independent of R. A similar exercise can be performed for TPB nucleation. injection, the reduction in C with R, leads to the saturation and also a dip of the growth rates at larger radii. S.3: Dependence of growth rates on C/Co by the LL and ML modes. 100 60 8 6 40 LL, R= 10 nm, 1 LL, R= 10 nm, 10 LL, R= 200 nm, 1 LL, R= 200 nm, 10 ML, 1 ML, 10 (b) 4 20 0 1 10 Growth Rate (nm/sec) Growth Rate (nm/sec) 80 (a) LL, R=10 nm, 1 LL, R=100 nm, 1 LL, R=1000 nm, 1 LL, R=10 nm, 10 LL, R=100 nm, 10 LL, R=1000 nm, 10 ML, 1 ML, 10 2 1.1 1.2 C/Co 1.3 1.4 1.5 0 1 1.5 2 C/Co 2.5 Variation in growth rate with C/Co as would be expected from eqs 26 and 28 for LL growth by IF nucleation and ML growth at (a) 1000C using SiCl4 and (b) 480C using SiH4. Plots for TPB nucleation are included in the supporting material as Figure 5(c) and (d). Points shown are NOT the results of calculations using the steady state equations but rather meant to help differentiate between the various curves. The shaded boxes represent the range of typical growth rates reported in the literature and hence the expected range of C/Co values. Numbers next to the values of radius, R, represent QD/kT values used. 3 S. 4 List of Equations LS kT ln( C 2 Au / Si ) Si o R C LS VS kT ln( P / P o ) (1) 2 Si R (2) 2 Au / Si VL kT ln( P / P 0 ) kT ln( C / C 0 ) R (3) dC dC dC dC dC dt dt 1or 3 dt 5 dt 6 dt 7 1or 2 (4) Adroplet K 1 P s K1 P s K3 dC s s dt 2 1 K 2 P droplet Vdroplet 1 K 2 P droplet R (5) S 2R K1P S K 4 dC K1P S 2 dt 1 K P S 3 2 diffusion Vdroplet 1 K 2 P diffusion R (6) a exp( Qdesorption Qsurfacediffusion 2kT Eq dC P P 1/ 2 dt 5 (2mkT ) ) K3 R o 2 Au / Si K 3 dC CP exp 1/ 2 RkT dt 5 (2mkT) R (7) (8) (9) (SiCl4)Gas or Adsorbed (Si)Gas or Adsorbed + 2(Cl2)gas or adsorbed (10a) (Si)Gas or Adsorbed (Si)Droplet (10b) Q R VL dC C [Cl ] 2 K 5 exp kT dt 6 (11) VL dC C K 6 exp dt 6 kT K 6 C o ( P / P o ) exp( KK dC 1 3 R dt 6 J IF K K PS 2 Au / Si ) 1 3 RkT R C /Co o P/P 2 (13) 2 2 Au / Si S exp( ) P RkT (14) 1 R 2 dh K 7 dh dC = dt 7 Vdroplet dt R dt (15) dh ( JR 2 )a dt LL IF (16a) dh ( J 2R)a dt LL TPB (16b) dh 2 ( J .r )a dt ML (17) Q C N oC o exp( D ) o kT C J TPB (12) C o Q C exp( D ) o kT C a 1/ 2 C ln o C C ln o C 1/ 2 K9 exp o ln( C / C ) (18a) K9 exp o ln( C / C ) (18b) r (v/2J )1 / 3 (19) 1 exp( QD / kT )C o ln( C / C o ) v a 1 1 / 2 exp( / 2kT ) 3 2RTransition J 1 v dh K 1 P S dt 1 K 2 P S K3 K 7 (20) (21) (22a) dh K 1 K 3 P S dt K7 (22b) 2622 exp( QR / RT ) K 3 P S kT dh dt K7 K P C ss / C o 1 K 3 K1 K 3 o 1 K 2 P droplet P/P C / C o K1 K 3 P K1 K 3 o P/P 2 2 (22c) 2 2 Au / Si K 7 dh exp( ) P RkT dt (23) 2 K 2 Au / Si exp P 7 (R 2 )aJ RKT (24) 1 2 C / C o 2 K9 2 Au / Si C 2 IF 2 C K 1 K 3 P 1 exp K K R ( ) ln( ) exp( ) (25) 7 10 o o o RKT C C ln C / C o P / P SS Q C SS dh aR 2 N oC o exp( D ) o kT C dt LL IF C SS ln o C 1/ 2 K9 (26) exp SS o ln( C / C ) 2 2 K 7 C / C o K1 K 3 P 1 exp .av 2/3 J 1 / 3 o RKT P/P S dh = ( / 4)1 / 3 .av 2/3 J 1 / 3 dt A V 3 a or R 3 SC (Cos 3Cos 2) (27) (28) (29)

