G - Pruffle
advertisement
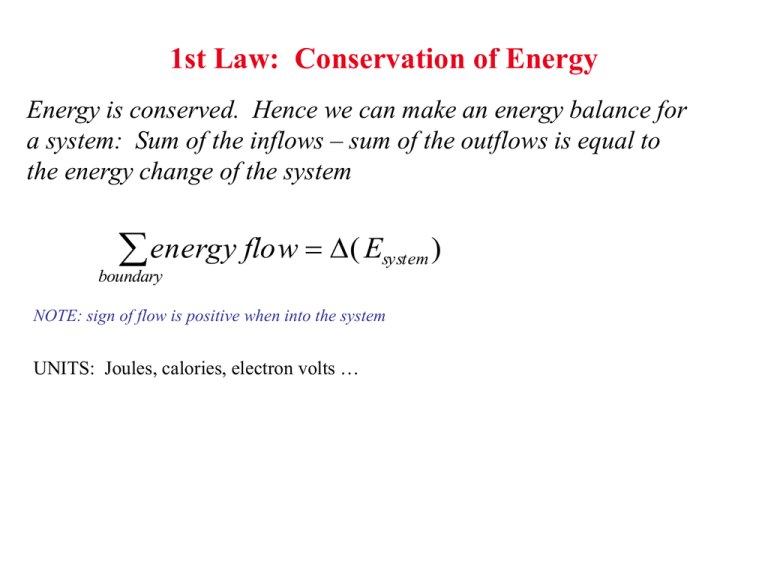
1st Law: Conservation of Energy Energy is conserved. Hence we can make an energy balance for a system: Sum of the inflows – sum of the outflows is equal to the energy change of the system energy flow ( Esystem ) boundary NOTE: sign of flow is positive when into the system UNITS: Joules, calories, electron volts … Types of Work Electrical W = – dq Magnetic W o V HdM Surface W = – dA Summary so far Variables and Parameters System is only described by its macroscopic variables Variables: Temperature + one variable for every work term that exchanges energy with the system + one variable for every independent component that can leave or enter the system. Parameters: Quantities that are necessary to describe the system but which do not change as the system undergoes changes. e.g. for a closed system: ni are parameters for a system at constant volume: V is parameter Equations of State (Constitutive Relations): equation between the variables of the system. One for each work term or matter flow Example of Equations of State pV = nRT: for ideal gas = E efor uniaxial elastic deformation M = H: paramagnetic material Properties and State Functions U = U(variables) e.g. U(T,p) for simple system Heat capacity 1 Q cp n dT p cV Volumetric thermal expansion Compressibility 1 Q n dT V 1 dV V V dT p 1 dV V V dp T Some Properties Specific to ideal gasses 1) PV = nRT ONLY for IDEAL GASSES 2) cp - cv = R U 3) 0 V T Proof that for ideal gas, internal energy only depends on temperature dU nc vdT The Enthalpy (H) H = U + PV Gives the heat flow for any change of a simple system that occurs under constant pressure Example: chemical reaction Example: Raising temperature under constant pressure dHp Qp n c p dT H cp dT p Enthalpy of Materials is always relative Elements: set to zero in their stable state at 298K and 1 atm pressure Compounds: tabulated. Are obtained experimentally by measuring the heat of formation of the compounds from the elements under constant pressure. The Enthalpy (H) H = U + PV Gives the heat flow for any change of a simple system that occurs under constant pressure Example: chemical reaction Example: Raising temperature under constant pressure dHp Qp n c p dT H cp dT p Enthalpy of Materials is always relative Elements: set to zero in their stable state at 298K and 1 atm pressure Compounds: tabulated. Are obtained experimentally by measuring the heat of formation of the compounds from the elements under constant pressure. Entropy and the Second Law There exists a Property of systems, called the Entropy (S), for which holds: dS Q T How does this solve our problem ? The Second Law leads to Evolution Laws Isolated system Evolution Law for constant Temperature and Pressure TdS dU pdV d(TS) dU d(pV) d(U pV TS) 0 dG ≤ 0 G (Gibbs free energy is the relevant potential to determine stability of a material under constant pressure and temperature Interpretation For purely mechanical systems: Evolution towards minimal energy. Why is this not the case for materials ? Materials at constant pressure and temperature can exchange energy with the environment. G is the most important quantity in Materials Science determines structure, phase transformation between them, morphology, mixing, etc. Phase Diagrams: One component Describes stable phase (the one with lowest Gibbs free energy) as function of temperature and pressure. Water Carbon Temperature Dependence of the Entropy dS Q T dSp Qp T S C p T p T Cp dTp T Temperature Dependence of the Entropy dS Q T dSp Qp T S C p T p T Cp dTp T What is a solution ? SYSTEM with multiple chemical components that is mixed homogeneously at the atomic scale •Liquid solutions •Vapor solutions •Solid Solutions Composition Variables MOLE FRACTION: ATOMIC PERCENT: CONCENTRATION: WEIGHT FRACTION: ni Xi n tot (at%)i 100% Xi Ci wi ni V or Wi Wtot Wi V Variables to describe Solutions G=G(T,p,n1,n2, …, nN) G G G dG dT dp dni T p,n p T , n ni p,T i i Partial Molar Quantity chemical potential G i ni p,T dG S dT V dp i dni Partial Molar Quantity V Vi ni T , p,n j H Hi ni T , p,n S S i n i T ,p, n j j Partial molar quantities give the contribution of a component to a property of the solution G i ni i V Vi ni i Properties of Mixing Change in reaction: XA A + XB B -> (XA, XB ) H mix H mix X A H A X B H B H mix H A X B H B H A Cu-Pd Ni-Pt Intercept rule with quantity of mixing General Equilibrium Condition in Solutions Chemical potential for a component has to be the same in all phases i i i ... For all components i OPEN SYSTEM Components have to have the same chemical potential in system as in environment e.g. vapor pressure Example: Solubility of Solid in Liquid Summary so far 1) Composition variables 2) Partial Molar Quantities 3) Quantities for mixing reaction 4) Relation between 2) and 3): Intercept rule 5) Equilibrium between Solution Phases Standard State: Formalism for Chemical Potentials in Solutions i RT ln( ai ) 0 i chemical potential of i in solution effect of concentration chemical potential of i in a standard state Choice of standard state is arbitrary, but often it is taken as pure state in same phase. Choice affects value of ai Models for Solution: Ideal Solution An ideal solution is one in which all components behave Raoultian ai xi for all i G mix G mixture G component s x A A xB B x A GA x B GB Gmix x A A0 RT ln aA xB 0B RT ln aB x A GA x B GB Gmix RTx A ln x A xB ln x B Summary Ideal Solutions G mix RT xi ln xi i H mix 0 S mix R xi ln xi i V mix 0 Solutions: Homogeneous at the atomic level Random solutions Ordered solutions Summary so far 1) Composition variables 2) Partial Molar Quantities 3) Quantities for mixing reaction 4) Relation between 2) and 3): Intercept rule 5) Equilibrium between components in Solution Phases For practical applications it is important to know relation between chemical potentials and composition Obtaining activity information: Experimental e.g. vapor pressure measurement pi i RT ln * pi * vapor pressure pi Pure substance i i RT lnai pi * ai pi vapor pressure pi Mixture with component i in it Obtaining activity information: Simple Models Raoultian behavior ai xi Henry’s behavior ai k xi Usually Raoultian holds for solvent, Henry’s for solute at small enough concentrations. Intercept rule General Equilibrium Condition in Solutions Chemical potential for a component has to be the same in all phases i i i ... For all components i OPEN SYSTEM Components have to have the same chemical potential in system as in environment e.g. vapor pressure Raoultian case and Real case Review • At constant T and P, a closed system strives to minimize its Gibbs free energy: G = H - TS • Mixing quantities are defined as the difference between the quantity of the mixture and that of the constituents. All graphical constructions derived for the quantity of a mixture can be used for a mixing quantity with appropriate adjustment of standard (reference) states. 0 GA XB 0 1 XB 1 GB A - G A B - G B G mix G Review (continued) Some simple models for solutions can be me made: Ideal solution, regular solution. Many real solution are much more complex than these ! Regular Solution G mix Hmix – TS mix xB (1 x B ) RTx A ln x A x B ln x B The Chord Rule What is the free energy of an inhomogeneous systems ( a system that contains multiple distinct phases) ? CHORD RULE: The molar free energy of a two-phase system as function of composition of the total system, is given by the chord connecting the molar free energy points of the two constituent phases The Chord Rule graphically With pure components Components are solutions B A XB overall composition is XB* overall composition is XB* G 0 XB G XB* XB 1 0 XB* XB 1 Regular Solution Model G mix xB (1 xB ) < 0 0 RT(1 xB )ln(1 xB ) xB ln xB XB 1 Regular Solution Model G mix xB (1 xB ) RT(1 xB )ln(1 xB ) xB ln xB > 0 0 XB 1 Effect of concave portions of G 0 XB* 1 Single-Phase and Two-phase regions 0 XB Singlephase XB* Two-phase 1 XB Singlephase Two-phase coexistence When Gmix has concave parts (i.e. when the second derivative is negative) the coexistence of two solid solutions with different compositions will have lower energy. The composition of the coexisting phases is given by the Common Tangent construction The chemical potential for a species is identical in both phases when they coexist. Common tangent does not need to be horizontal 0 XB* 1 Temperature Dependence of Two-phase region Hmix 0 XB Low temperature Hmix 1 0 XB Hmix 1 Intermediate temperature 0 XB High temperature 1 Phase Diagram of Regular Solution Model with >0 T 0 XB 1 Example: Cr-W Miscibility gap does not have to be symmetric Lens-Type Diagram Free energy curves for liquid and solid T > TBM > TAM G 0 G 1 XB TBM > T > TAM 0 1 XB G TBM > TAM > T 0 1 XB How much of each phase ? - The Lever Rule Since the composition of each phase is fixed by the common tangent, the fraction of each phase can be determined from requiring that the system has the given overall composition X *B f X B f X B 1 f f -> solve for f and f The result is known as the Lever Rule X B X *B f X B X B XB* X B f X B X B Lever Rule f x x x f x x x 0 In a two-phase region chemical potential is constant XB 1 XB 1 G 0 Comparison between Eutectic and Peritectic Eutectic Peritectic L L Cooling: L -> Heating: -> L + Nucleation (1) The structure of the liquid Many small closed packed solid clusters are present in the liquid. These clusters would form and disperse very quickly. The number of spherical clusters of radius r is given by Gr nr n0 exp kT nr : average number of spherical clusters with radius r. n0: total number of atoms in the system. Gr: excess free energy associated with the cluster. (2) The driving force for nucleation The free energies of the liquid and solid at a temperature T are given by GL = HL- TSL and GS = HS- TSS GL and GS are the free energies of the liquid and solid respectively. HL and HS are the enthalpy of the liquid and solid respectively. SL and SS are the entropy of the liquid and solid respectively. At temperature T, we have GV = GL- GS = HL-HS-T(SL-SS) =H-TS, GV: volume free energy. where H and S are approximately independent of temperature. For a spherical solid of radius r, 4 G r 3GV 4r 2 SL 3 For a given T, the solid reach a critical radio r*, when 3 16 SL G 3( GV ) 2 We get d ( G) 0 dr and r* If G T Tm GV Lm 3 16 SL Tm 2 3( Lm ) 1 T 2 2 SL GV then, * and r 2 SL Tm 1 Lm T When r < r, the solid is not stable, and when r > r, the solid is stable. The effect of temperature on the size of critical nucleation and the actual shape of a nucleus. (4) Heterogeneous nucleation If a solid cap is formed on a mould, the interfacial tensions balance in the plane of the mould wall, or SM ML SM SL cos cos ML SL SL, SM and ML: the surface tensions of the solid/liquid, solid/mould and mould/liquid interfaces respectively. The excess free energy for formation of a solid spherical cap on a mould is Ghet = -VSGV + ASLSL + ASMSM - ASMML Where VS: the volume of the spherical cap. ASL and ASM: the areas of the solid/liquid and solid/mould interfaces. It can be easily shown that, 4 Ghet ( r 3GV 4r 2 SL ) f ( ) 3 where (2 3 cos cos3 ) f ( ) 4 (c) Nucleation rate and nucleation time as a function of temperature The overall nucleation rate, I, is influenced both by the rate of cluster formation and by the rate of atom transport to the nucleus, which are both influenced in term by temperature. TTT diagram gives time required for nucleation, which is inversely proportional to the nucleation rate. 860 840 820 800 780 760 740 720 700 680 660 640 620 600 100 1000 Actual examples of TTT diagram 10000 Nucleation in Solid Interface structure Coherency loss rcrit 3 st 42 Homogeneous Nucleation (a) Homogeneous nucleation The free energy change associated with the nucleation process will have the following three contributions. 1 . At temperatures where the phase is stable, the creation of a volume V of will cause a volume free energy reduction of VGv. 2. Assuming for the moment that the / interfacial energy is isotropic the creation of an area A of interface will give a free energy increase of A. 3. In general the transformed volume will not fit perfectly into the space originally occupied by the matrix and this gives rise to a misfit strain energy Gv, per unit volume of . (It was shown in Chapter 3 that, for both coherent and incoherent inclusions, Gv, is proportional to the volume of the inclusion.) Summing all of these gives the total free energy change as G VGV A VGS If we assume the nucleus is spherical with a radius r, we have 4 G 3 r 3 ( GV G S ) 4r 2 Similarly we have r* G 2 ( GV G S ) 16 3 3( GV G S )2 Nucleation at Grain Boundary The excess free energy associated with the embryo at a grain boundary will be given by G = -VGv + A - A Where V is the volume of the embryo, A is the area of / interface of energy created, and A the area of / grain boundary of energy destroyed during the process. cos 2 Fick I It would be reasonable to take the flux across a given plane o be proportional to the concentration gradient across the plane: c J D x J: the flux, [quantity/m2s] D: diffusion coefficient, [m2/s] c x Concentration gradient, [quantity /m-4] Here, quantity can be atoms, moles, kg etc. Fick II: C t D 2C x 2 Solution to Fick II 1. Thin Film (Point Source) Solution assume boundaries at infinity c(x,t) c(x,0) M (x) c(,t) c(,t ) 0 2 M x exp 4 Dt 4Dt c(x,t) 2 M x exp 4 Dt 4Dt Measurement of diffusion coeffiecient c(x,t) 2 M x exp 4 Dt 4Dt x x2 ln c constant 4Dt If c versus x is known experimentally, a plot of ln(c) versus x2 can then be used to determine D. Error functions 2 2 exp(x ) x 0 2 exp(u2 ) du erf (x) e rf( 0 ) 0 e rf( ) 1 e rfc( x ) 1 e rf( x ) e rf( z ) e rf( z ) c( x , t ) c' 2 Dt exp x 0 The final solution should be: c' x c( x , t ) 1 e rf 2 2 Dt 2 d 4Dt When x=0, the composition is always kept at c=c’/2 c( x , t ) x c( x , t ) C s 1 e rf 2 Dt erf(-z)=-erf(z) x c( x , t ) Cs 1 e rf 2 Dt c' x 1 e rf 2 2 Dt Diffusion Mechanis Interstitial mechanism Self Diffusion with Vacancy These are the two most common mechanisms Ring Mechanism Interstitialcy A Random Jump Process J1 1 Bn1 6 1 J 2 Bn 2 6 J B J1 J 2 1 B ( n1 n 2 ) 6 C CB ( 1 ) CB ( 2 ) B x 1 C J B B 2 B 6 x Diffusion by Vacancy mechanism DA 1 B 2 6 Gm B zX v exp RT Gv Xv exp RT DA 1 2 S S v Hm H v z exp m exp 6 R RT Q DA D0 exp RT D0 1 2 S S v z exp m 6 R Effeect of temperature on diffusion Q DA D0 exp RT Effect of defect on diffusion

