Feb. 16 lab
advertisement
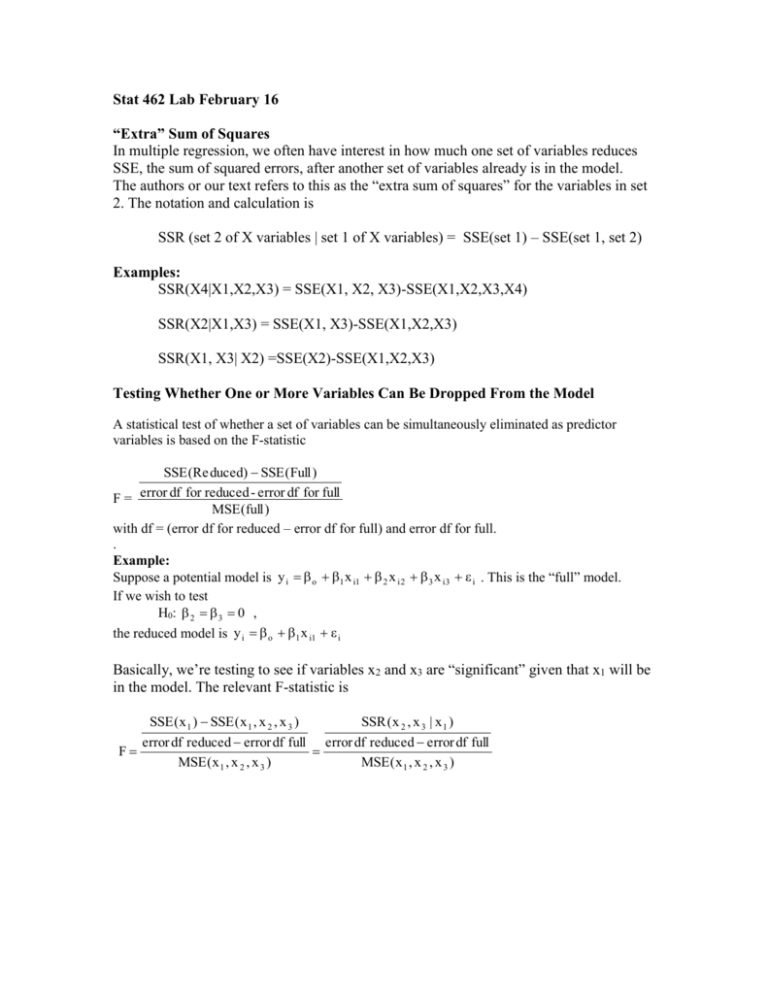
Stat 462 Lab February 16 “Extra” Sum of Squares In multiple regression, we often have interest in how much one set of variables reduces SSE, the sum of squared errors, after another set of variables already is in the model. The authors or our text refers to this as the “extra sum of squares” for the variables in set 2. The notation and calculation is SSR (set 2 of X variables | set 1 of X variables) = SSE(set 1) – SSE(set 1, set 2) Examples: SSR(X4|X1,X2,X3) = SSE(X1, X2, X3)-SSE(X1,X2,X3,X4) SSR(X2|X1,X3) = SSE(X1, X3)-SSE(X1,X2,X3) SSR(X1, X3| X2) =SSE(X2)-SSE(X1,X2,X3) Testing Whether One or More Variables Can Be Dropped From the Model A statistical test of whether a set of variables can be simultaneously eliminated as predictor variables is based on the F-statistic SSE (Re duced) SSE (Full ) F = error df for reduced - error df for full MSE (full ) with df = (error df for reduced – error df for full) and error df for full. . Example: Suppose a potential model is y i o 1 x i1 2 x i 2 3 x i 3 i . This is the “full” model. If we wish to test H0: 2 3 0 , the reduced model is y i o 1 x i1 i Basically, we’re testing to see if variables x2 and x3 are “significant” given that x1 will be in the model. The relevant F-statistic is SSE ( x 1 ) SSE ( x 1 , x 2 , x 3 ) SSR ( x 2 , x 3 | x 1 ) error df reduced error df full error df reduced error df full F MSE ( x 1 , x 2 , x 3 ) MSE ( x 1 , x 2 , x 3 ) Activity 1 Use the dataset C-SENIC.txt dataset at www.stat.psu.edu/~rho/462data/ For this activity, Y = InfctRisk, the risk of infection at a hospital X1 = Stay, average length of stay at the hospital X2 = Cultures = average number of bacterial cultures per day at the hospital X3 = Age, average age of patients at hospital X4 = Census, the average daily number of patients X5 = Beds, the number of beds in the hospital. a. Determine the value of SSR(X5 | X1,X2, X3, X4) To do this, you’ll need the value of SSE for a model with just X1, X2, X3, X4 and for a model with all five variables as predictors. Note: When listing predictors in Minitab, list them in the order given for X1… X5 in the problem description. b. Write a sentence that interprets the value computed in the previous part. c. Refer to part (a). Look at the output for the five variable model. Find the section of output labeled “SEQ SS.” How does the value given for X5 (Beds) compare to answer computed in part (a)? d. Determine the value of SSR(X4 | X1,X2, X3). e. Refer back to output you generated for the five variable model. Compare the “SEQ SS” for X4 to the value determined in part (d). f. In general, what do you think is given in the Minitab chart labeled “SEQ SS” ? g. Refer back to the output for the model that includes all five predictors. Based on the tstatistics, which variables appear to be “not significant?” h. In the five variable model y i o 1 x i1 2 x i 2 3 x i3 4 x i 4 5 x i5 i Determine the value of the F-statistic for testing H0: 3 4 5 0 (age, census, and beds can be dropped as predictors) Hint: You already have output for the “full” model. What’s the reduced model? i. What are the numerator and denominator df for the F-statistic found in part h? j. Find a p-value for our F-test. Use Calc>Probability Distributions>F. Fill in the numerator df and denominator df in the appropriate boxes. Click on Input Constant and fill in the corresponding box with the value of F found in part (h). Click OK. Subtract the resulting probability form 1 to get the p-value (because the p-value is the area t the right of our computed F). What is the p-value? What is indicated about the null hypothesis? k. Assuming the goal is to create a model that includes only “significant” variables, what would you try next?
