Determination of fluoride in drinking water with ion
advertisement
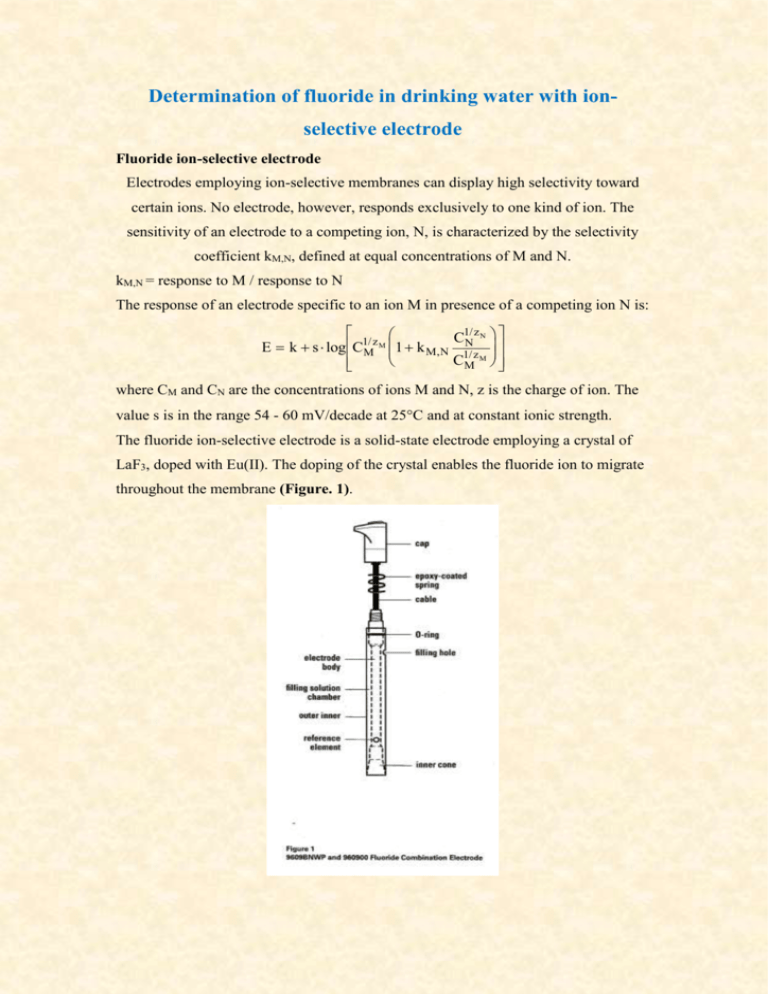
Determination of fluoride in drinking water with ionselective electrode Fluoride ion-selective electrode Electrodes employing ion-selective membranes can display high selectivity toward certain ions. No electrode, however, responds exclusively to one kind of ion. The sensitivity of an electrode to a competing ion, N, is characterized by the selectivity coefficient kM,N, defined at equal concentrations of M and N. kM,N = response to M / response to N The response of an electrode specific to an ion M in presence of a competing ion N is: C1/ z N E k s log C1M/ z M 1 k M, N 1N/ z CM M where CM and CN are the concentrations of ions M and N, z is the charge of ion. The value s is in the range 54 - 60 mV/decade at 25C and at constant ionic strength. The fluoride ion-selective electrode is a solid-state electrode employing a crystal of LaF3, doped with Eu(II). The doping of the crystal enables the fluoride ion to migrate throughout the membrane (Figure. 1). The response of the fluoride electrode in the presence of a competing anion N is given by equation: C1/ z E k s log C F 1 k F, N N C F where CF and CN are the concentrations of fluoride and of the competing species N. The fluoride electrode yields a nearly Nernstian response over a concentration range of 1 - 10-6 M F- at a constant ionic strength and at a constant temperature (Figure 2). The electrode operates with relatively few interferences. Interfering species are: hydronium ions, which below pH 5 form HF and HF2- complexes; iron(III), silicon, aluminum and other polyvalent cations, which also form complexes with fluoride ion; hydroxide ions, which compete with the fluorides with a selectivity coefficient kF,OH = 0.1. The degree of interference caused by the competing ion OH- is determined by the term kF,OH·COH / CF: for kF,OH·COH / CF << 1, the interference is negligible; for kF,OH·COH / CF >>1, the effect of the competing ion is predominant. The effect of interference at low-level concentrations of fluoride at different pH values is given in table below. In order to ensure negligible effect of the OHcompeting ion, the pH should be lower than 7. Degree of interference of OH-, expressed as kF,OHCOH / CF pH kF,OHCOH / CF CF = 10-5 M CF = 10-6 M 11 10 100 10 1 10 9 0.1 1 8 0.01 0.1 7 0.001 0.01 The time response of the electrode (the time required to reach 99% of the stable potential reading) varies from several seconds in concentrated solutions to several minutes near the limit of detection. Measurements with a fluoride electrode are performed in presence of TISAB (Total Ionic Strength Adjusting Buffer). TISAB should provide constant ionic strength of the solution, adjusting the pH and complex the interfering species. The type of TISAB depends on the composition of the sample. Drinking water contains less than 1.5 ppm F- (7.5·10-5 M) and negligible amounts of interfering species. A suitable composition of TISAB for drinking water is 0.01 M acetate buffer pH 5 - 5.5 in 1 M NaCl and 4 g/l CDTA. The TISAB is added to the sample in volume ratio 1:1. The acetate buffer keeps the pH at the optimal value, at which the formation of HF and HF2- is negligible, and the response of the electrode to hydroxides is virtually zero. NaCl is added to maintain constant ionic strength, independent of the composition of the sample. For the specific configuration of the reference electrode (AgCl-coated silver wire), used in this experiment, the constant concentration of chlorides is needed to ensure the constant value of the electrode potential. CDTA, chelating agent similar to EDTA, complexes polyvalent ions, which otherwise complex with F-. The effect of Fe(III)-F complexes on the determination of fluorides in drinking water Fe(III) forms three complexes1 with F-: FeF2+, FeF2+, FeF3. Fe3+ + F- = FeF2+ Kfl = 105 FeF2+ + F- = FeF2+ Kf2 = 103.9 FeF2+ + F- = FeF3 Kf3 = 103 Only uncomplexed, free fluoride is measured by the fluoride selective electrode. In order to illustrate the effect of complexation, the concentration of the different complexes as function of the total concentration of F- is shown in Fig.3a. The calculations are performed for 2·10-5 M Fe(III), concentration considered as the highest permissible in drinking water. The concentration of uncomplexed iron decreases with increasing concentration of fluoride. Around [F-]total = 5·10-5 M the predominant complex is FeF2+. Beyond [F-]total = 1·10-4 M the predominant species is FeF2+. The data from Fig.3a are also presented as F , the fraction of free fluoride to the total concentration of all fluoride species, as a function of the total concentration of fluoride (Fig.3b). The value of F is considerably lower than unity in the typical concentration range of fluoride in drinking water. The lower the total concentration of Fe3+, the higher F . For the determination of the total F- concentration, the chelating agent CDTA (forming a complex with Fe(III) with a high formation constant) is added. This allows the determination of F- concentration, independent of the level or nature of dissolved minerals. In a 1 ppm fluoride sample the TISAB complexes about 5 ppm iron or aluminum. a [ FeFn ], M 20 b 1 Fe 3 0.8 FeF2 15 10 F FeF2 5 0 FeF3 0 50 100 total [F 150 ], M 200 0.6 0.4 0.2 0 0 50 100 150 200 [ Ftotal ], M Fig.3 Concentration of the Fe(III)-F complexes (a) and F (b) as function of the total concentration of F-.The calculations are performed for [Fe3+ ]total = 2·10-5 M. The dashed area represents the concentration range of fluorides, typical to drinking water. Experimental part Chemicals 1. 10-2 M NaF 2. 10-3 M NaF 3. TISAB containing 0.01 M acetate buffer pH 5-5.5, 1 M NaCl and 4 g/l CDTA (1,2-diaminocyclohexane N,N,N',N'-tetraacetic acid) Electrodes: Combined Fluoride ion-selective electrode and Ag/AgCl reference electrode Procedure Check the connection of the electrodes to the pH-meter. Set the meter to voltage reading. Calibration curve for the fluoride standards is constructed in the range 10-2 - 5·10-6 M. Prepare standard solutions of 10-4 M, 10-5 M and 5·10-6 M NaF in 50 ml volumetric flasks. Transfer into small beakers equal volume of each of the fluoride solution (standards and analytes) and of the TISAB buffer. Deep the electrode into the solution and record stable voltage reading of the potential for each fluoride solution. At the end of the working session rinse the system with distilled water. Construct a calibration curve (potential vs concentration of fluoride). Mark the X-axis in mole/l and ppm. Report the concentration of the fluorides in drinking water samples in mole/l and ppm. Reference 1. “Stability constants of metal-ion complexes”, L. G. Sillen and A. E. Martell, Special Publication #17, London: The Chemical Society, Burlington House, 1964. Recommended Literature 1. D. C. Harris, Quantitative Chemical Analysis.
