Microsoft Word document
advertisement
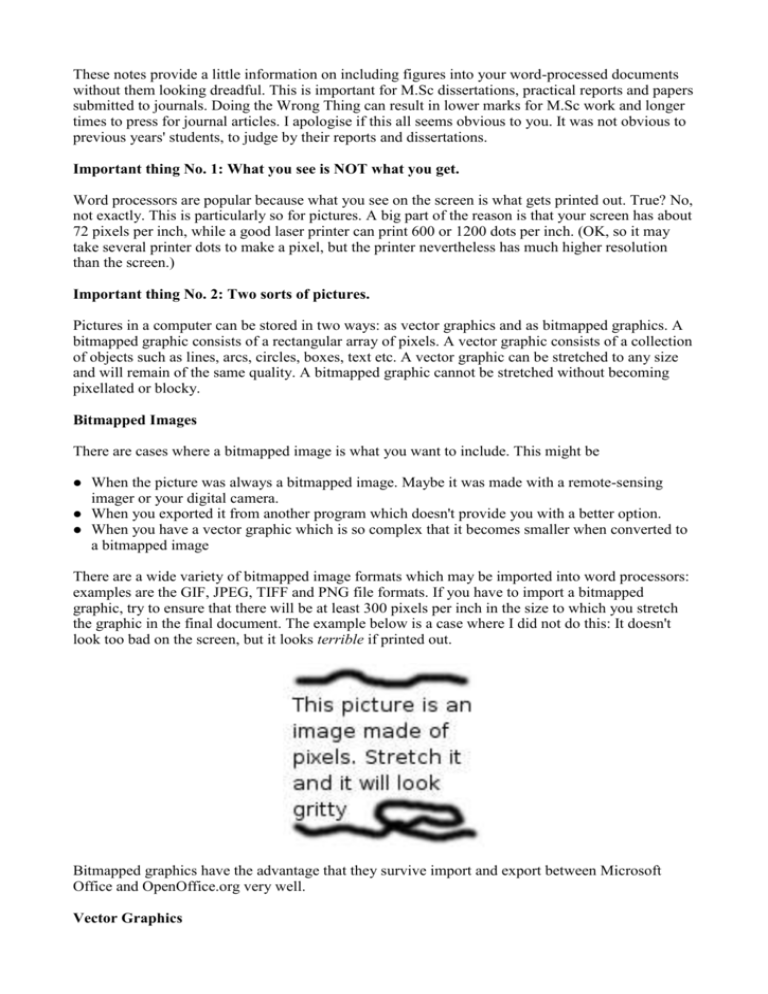
These notes provide a little information on including figures into your word-processed documents without them looking dreadful. This is important for M.Sc dissertations, practical reports and papers submitted to journals. Doing the Wrong Thing can result in lower marks for M.Sc work and longer times to press for journal articles. I apologise if this all seems obvious to you. It was not obvious to previous years' students, to judge by their reports and dissertations. Important thing No. 1: What you see is NOT what you get. Word processors are popular because what you see on the screen is what gets printed out. True? No, not exactly. This is particularly so for pictures. A big part of the reason is that your screen has about 72 pixels per inch, while a good laser printer can print 600 or 1200 dots per inch. (OK, so it may take several printer dots to make a pixel, but the printer nevertheless has much higher resolution than the screen.) Important thing No. 2: Two sorts of pictures. Pictures in a computer can be stored in two ways: as vector graphics and as bitmapped graphics. A bitmapped graphic consists of a rectangular array of pixels. A vector graphic consists of a collection of objects such as lines, arcs, circles, boxes, text etc. A vector graphic can be stretched to any size and will remain of the same quality. A bitmapped graphic cannot be stretched without becoming pixellated or blocky. Bitmapped Images There are cases where a bitmapped image is what you want to include. This might be When the picture was always a bitmapped image. Maybe it was made with a remote-sensing imager or your digital camera. When you exported it from another program which doesn't provide you with a better option. When you have a vector graphic which is so complex that it becomes smaller when converted to a bitmapped image There are a wide variety of bitmapped image formats which may be imported into word processors: examples are the GIF, JPEG, TIFF and PNG file formats. If you have to import a bitmapped graphic, try to ensure that there will be at least 300 pixels per inch in the size to which you stretch the graphic in the final document. The example below is a case where I did not do this: It doesn't look too bad on the screen, but it looks terrible if printed out. Bitmapped graphics have the advantage that they survive import and export between Microsoft Office and OpenOffice.org very well. Vector Graphics Vector graphics may come from a variety of sources: Drawing programs such as OpenOffice draw, Xfig, inkscape, Adobe Illustrator Graph plotting packages such as IDL, R They also come in a variety of file formats: PostScript (.ps or .eps), Portable Document format (.pdf), Windows Metafile (.wmf), Enhanced Metafile (.emf), Scalable Vector Graphic (.svg), Xfig's native format (.fig) and others. Note that one of the sorts of objects you can put in many of these file formats is a bitmap object. It could even be the only object in the file, so that you have a bitmap graphic stored in a vector graphic file format. (The reverse does not happen: you can't store a vector graphic in a .gif or .png file, for example.) Word processors are pretty pathetic at incorporating vector graphics. OpenOffice.org can import the following formats: Autocad Exchange (.dxf), Enhanced Metafile (.emf), Encapsulated PostScript(.eps), Windows MetaFile (.wmf). Microsoft Word claims to import Windows Metafile, (Windows) Enhanced Metafile and encapsulated PostScript, but in my experience, importing Enhanced Metafiles doesn't always work. Neither word processor can import SVG or PDF figures. Given that the easiest vector graphics output from R is PostScript, that is what we will have to use, so we need to say a bit more about it. PostScript is actually a complete computer language – you can write programs in it. Postscript was originally designed to be understood by laser printers. All the programs that you use during your M.Sc print by generating a PostScript file and sending that to the printer. PostScript was originally designed to represent whole pages. To represent a figure that you can include in a document, you need a special flavour of PostScript called encapsulated PostScript. An encapsulated PostScript file Represents a single page or less. Contains a Bounding Box which specifies how big the figure is. May or may not contain a low-resolution preview image for the benefit of programs that can not interpret the PostScript code themselves. To get an eps graphic from R, try something like this: postscript(file="myplot.eps",width=6,height=5,paper="special",onefile=FALSE, family="Times",horizontal=FALSE,pointsize=14) myplot()## Replace this with all your plotting commands dev.off() The figure below is an eps file with NO preview. Files produced by R are like this. MS Word and OpenOffice 2 will sometimes generate a preview for you when you include such a file. (OpenOffice.org 1 never did, so the graphic would always look like a box with a message in it. The graphic would still print properly on a PostScript printer.) A really annoying gotcha: if you export a document from OpenOffice as a Microsoft Word document, all the incorporated PostScript figures vanish and have to be re-imported. That isn't true for vector graphics imported as enhanced metafiles, but Microsoft Word may refuse to either display or print your graphic. Word processors regard encapsulated PostScript as just a blob to be printed. They are a little friendlier to Enhanced Metafiles. You can get R to produce an enhanced metafile like this: xfig(file="myplot.fig",width=6,height=5,onefile=TRUE, family="Times",horizontal=FALSE,pointsize=14) myplot() ## Replace this with all your plotting commands dev.off() system("fig2dev -L emf myplot.fig myplot.emf") 0.8 1.0 Note that we have done this by getting R to produce a figure in xfig format and using the external Voltage Current t 0.4 I = v ( t ) dt 0 -0.4 0.0 0.2 Signal 0.6 What's this? 0 2 4 6 8 10 12 Time / s program fig2dev to convert to emf: As you can see, the result is slightly less satisfactory than using encapsulated PostScript: fig2dev has lost the integral sign. But the word processors handle it better. To sum up, your workflow for including non-image graphics should look as much like this as possible: IDL or R Encapsulated PostScript File Word Processor Xfig Enhanced Metafile PostScript File Printer Other (That's another vector graphic, of course. This time it was drawn with xfig.) The pale arrows indicate that you may lose some parts of your figures if you take the “Enhanced Metafile” route. Given the import/export problems, I would suggest choosing either OpenOffice or MicroSoft Office and not switching from one to the other in the middle of writing your report. Of course, you could always use LaTeX!
