Tables, Equations,… and Functional Notation
advertisement
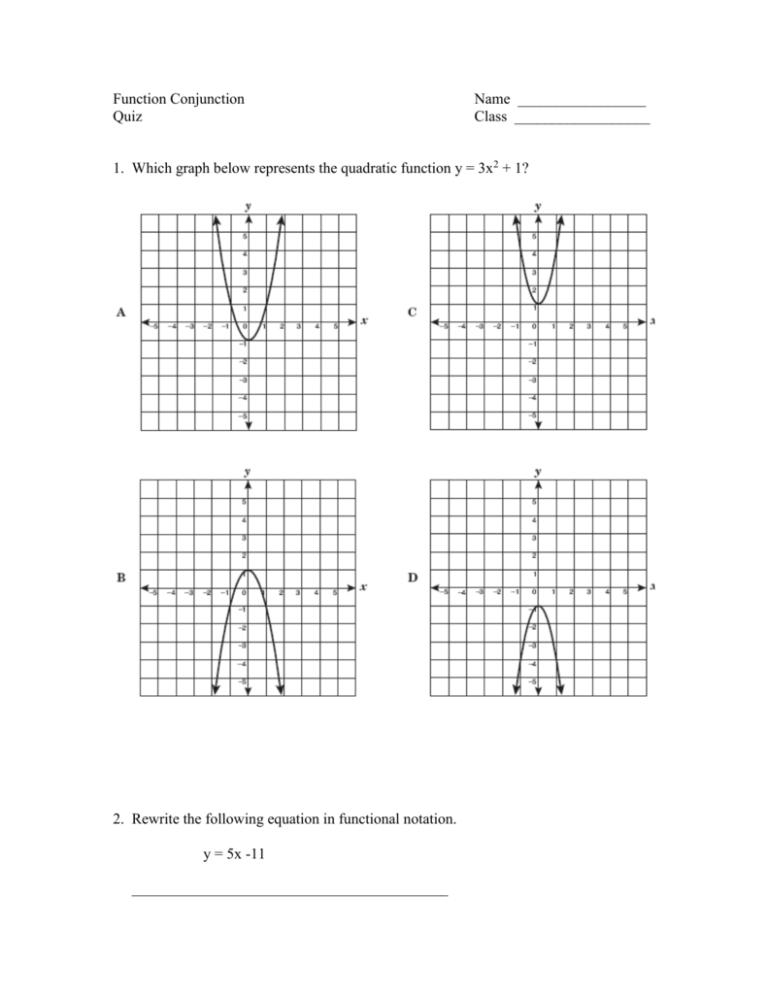
Function Conjunction Quiz Name _________________ Class __________________ 1. Which graph below represents the quadratic function y = 3x2 + 1? 2. Rewrite the following equation in functional notation. y = 5x -11 __________________________________________ 3. Which table contains points on the graph of the function f(x) = 4 – 2x? 4. Josie’s CD player is playing at a volume of 75 decibels. If the decibel level reaches 120 decibels, the neighbors will complain. Which inequality models q, the number of decibels Josie can increase the volume before the neighbors complain? A B C D 75 + q < 120 75 – q > 120 75 + q > 120 75 – q < 120 5. Which graph represents the inequality 2x + y ≤ 10? 6. Jane started a weekend pet-care business. She bought the necessary supplies for $210. Jane charges $25 per weekend for each pet she cares for. Which function best represents her net profit in terms of x, the number of pets she cares for? A B C D f(x) = x + 25 – 210 f(x) = 210 – 25x f(x) = 210x – 25 f(x) = 25x – 210 7. Which data set is best described by the function y = -x2 + 0.5x? 8. The table below shows the prices for different weights of packages of strawberries at a market. Which equation can be used to find the price, p, of any weight, w, of packages of strawberries? A B C D p = 0.43 w p = 0.85 w p = 3.40 w p = 1.70 w 9. Paul uses his truck to carry boxes of cable. His truck weighs 4000 pounds. Each box of cable weighs 100 pounds. Which table correctly shows the weight of Paul’s truck when it carries different numbers of boxes? 10. Which inequality best describes the graph below? A B C D x–y≤3 x+y≤3 x + y ≥ -3 x – y ≤ -3


