Mid1Sol
advertisement
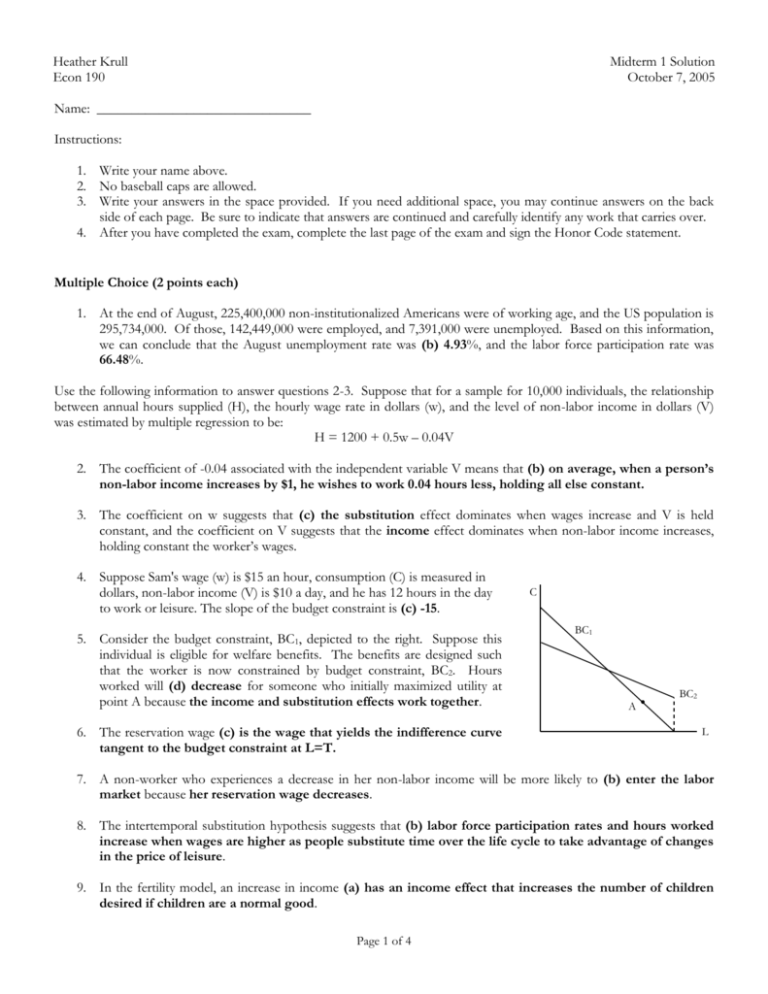
Heather Krull Econ 190 Midterm 1 Solution October 7, 2005 Name: _______________________________ Instructions: 1. Write your name above. 2. No baseball caps are allowed. 3. Write your answers in the space provided. If you need additional space, you may continue answers on the back side of each page. Be sure to indicate that answers are continued and carefully identify any work that carries over. 4. After you have completed the exam, complete the last page of the exam and sign the Honor Code statement. Multiple Choice (2 points each) 1. At the end of August, 225,400,000 non-institutionalized Americans were of working age, and the US population is 295,734,000. Of those, 142,449,000 were employed, and 7,391,000 were unemployed. Based on this information, we can conclude that the August unemployment rate was (b) 4.93%, and the labor force participation rate was 66.48%. Use the following information to answer questions 2-3. Suppose that for a sample for 10,000 individuals, the relationship between annual hours supplied (H), the hourly wage rate in dollars (w), and the level of non-labor income in dollars (V) was estimated by multiple regression to be: H = 1200 + 0.5w – 0.04V 2. The coefficient of -0.04 associated with the independent variable V means that (b) on average, when a person’s non-labor income increases by $1, he wishes to work 0.04 hours less, holding all else constant. 3. The coefficient on w suggests that (c) the substitution effect dominates when wages increase and V is held constant, and the coefficient on V suggests that the income effect dominates when non-labor income increases, holding constant the worker’s wages. 4. Suppose Sam's wage (w) is $15 an hour, consumption (C) is measured in dollars, non-labor income (V) is $10 a day, and he has 12 hours in the day to work or leisure. The slope of the budget constraint is (c) -15. 5. Consider the budget constraint, BC1, depicted to the right. Suppose this individual is eligible for welfare benefits. The benefits are designed such that the worker is now constrained by budget constraint, BC2. Hours worked will (d) decrease for someone who initially maximized utility at point A because the income and substitution effects work together. 6. The reservation wage (c) is the wage that yields the indifference curve tangent to the budget constraint at L=T. C BC1 A BC2 L 7. A non-worker who experiences a decrease in her non-labor income will be more likely to (b) enter the labor market because her reservation wage decreases. 8. The intertemporal substitution hypothesis suggests that (b) labor force participation rates and hours worked increase when wages are higher as people substitute time over the life cycle to take advantage of changes in the price of leisure. 9. In the fertility model, an increase in income (a) has an income effect that increases the number of children desired if children are a normal good. Page 1 of 4 10. Suppose that Jack’s wage rate is $20 and that his marginal product of time in the household sector is $10 per hour. Suppose also that Jill’s wage rate is $30 and that her marginal product of time in the household sector is $15 per hour. We know that (b) it doesn’t matter who specializes in the tasks, because neither Jack nor Jill has a comparative advantage in either activity. Short Answer/Applications (30 total points): Show your work. 1. (4 points) The utility function of a worker is represented by U( C, L ) C 2 L 2 . The marginal utility of 1 1 leisure is then given by MUL 21 C 2 L 1 1 2, 1 and the marginal utility of consumption is given by 1 MUC 21 C 2 L 2 . Suppose that this person currently spends $81 on consumption and enjoys 16 hours of leisure per day How many hours of leisure would a non-worker sacrifice to gain an additional $63 dollars worth of income? 1 1 At the current consumption and leisure levels, this non-worker enjoys U1 = 81 2 16 2 = 9 * 4 = 36 units of utility. In order to be equally happy, or to be willing to sacrifice one good for another, the utility level must remain constant when the individual gains $63 in additional income. The new income level is $81 + $63 = $144, and U2=36. Thus: 1 1 U 2 = 144 2 L 2 = 36 1 1 12 2 L 2 = 36 1 L 2 =3 ∴L = 9 Therefore,is non-worker is willing to sacrifice 16 – 9 = 7 hours of leisure in order to enjoy $144 in total income. 2. (6 points) Suppose the government grants $2500 per child to households that have two or more children. Do these child allowances influence the fertility behavior of households that had no children prior to the government program? Graph and explain. You may assume for simplicity that initially V = 0. Assume the original budget line of a family that wishes to have no children is given by ABC. The budget line will become ABDE when the child subsidy program is enacted. If a X family is willing to have two children, the government provides them with $5000, if they have three children, they will receive $7500, etc. A D This system creates a new portion of the budget line (DE) which is flatter than the original since the subsidy increases when the number 5000 of children increase. 7500 The result, there are two changes to consider. The budget line is similar to a decrease in the cost of Theoretically, when the price of children decreases, incentive to substitute children for the commodity prices have changed. B flattening of the having children. families have an good as relative C N1 2 N2 3 E N Additionally, the outward shift of the budget constraint serves as an increase in the opportunity set. The income effect suggests that with a high level of income, families will demand higher quantities of all normal goods, children included. Therefore, both the income and substitution effects suggest that some families will demand more children. As drawn, the family will now have N2 children and take advantage of the child subsidy program. Page 2 of 4 3. (20 points + 2 bonus points) Suppose Larry is offered an hourly wage of w, his non-labor income (V) is $1,920, consumption (C) is measured in dollars, and he has 120 hours to work (H) or leisure (L). Suppose also that Larry derives utility from consumption and leisure according to the utility function: U = LC 2 . As such, his marginal utility functions are MU L = C 2 and MU C = 2LC. a. (2 bonus points) Should Larry accept an $7/hour wage offer? For credit, explain. [Note: This is a tricky problem, but solvable. I recommend working on this after you’ve done what you can on the rest of the exam.] This problem requires that you solve for Larry’s reservation wage, the wage offer that makes him indifferent between working and not working. Thus, it is the slope of his indifference curve at the endowment point, V. The slope of his indifference curve is given by: MUL C2 C = = MUC 2LC 2L At the endowment point, i.e. not working, Larry’s consumption level is made up of just his non-labor income, and L = T. Therefore, MUL ~ 1920 =w= = $8 MUC 2(120 ) Larry should not accept a $7 wage offer, because his reservation wage is $8. Any offer in excess of $8 will be enough to entice him to choose H* > 0. b. (6 points) Suppose now that Larry is offered a wage of $10 per hour. Provide the equation of his daily budget constraint and graph it in the space provided below. Carefully label the axes, and indicate intercepts and the slope of the budget constraint. Budget constraint: C = V + wH = 1920 + 10(120 – L) C P Q: Income Effect (H↓) Q R: Substitution Effect (H↑) 3840 R 3120 slope = -w = -10 Q U2 P U1 slope = -16 1920 120 Page 3 of 4 L c. (7 points) Now, consider a wage increase from $10 per hour to $16 per hour. Assume consumption simultaneously increases from $2080 to $2560. State, interpret, and use the utilitymaximization labor supply rule to determine how many hours Larry will work when his wages change. Also, calculate and interpret Larry’s elasticity of labor supply when the wage rate changes from $10 to $16 per hour. Is his responsiveness to wage changes elastic or inelastic? The optimal level of consumption and leisure occurs at the tangency of the budget constraint and indifference curve. At the tangency, the slopes of the two lines is equal, so MUL MU = w ⇒ L = MUC MUC w The condition can be interpreted as follows: at the tangency, the additional utility enjoyed from spending an additional dollar on leisure is exactly equal to the additional utility enjoyed from spending an additional dollar on consumption. In other words, the individual is indifferent between consuming more leisure or consumption. Using this condition, we can solve for the optimal amount of leisure, and from that, hours of work: w = $10, C = $2080, H1* = T – L* = T – 104 = 16 MUL C 2080 2080 = w⇒ = w⇒ = 10 ⇒ = L ⇒L* = 104 MUC 2L 2L 20 w = $16, C = $2560, H2* = T – L* = T – 80 = 40 MUL C 2560 2560 = w⇒ = w⇒ = 16 ⇒ = L ⇒L* = 80 MUC 2L 2L 32 H %H H 1 H w 1 The elasticity of labor supply is given by the formula: and is calculated here %w w H 1 w w1 ΔH w 1 40 - 16 10 as σ = = = 2.5. This suggests that when wages increase by 1%, hours of work H 1 Δw 16 16 - 10 will increase by 2.5%. Because |σ| > 1, this is considered elastic labor supply, which means Larry is relatively responsive in terms of hours worked to wage changes. A positive elasticity of labor supply indicates that Larry’s substitution effect dominates in this example. d. (7 Points) Finally, on the original graph, illustrate this wage change graphically (with appropriate labels – slope, intercepts, etc). His hours worked will now increase. Explain using income/substitution effects. Decompose the graphical change in hours worked into income and substitution effects. [Note: Your graph should correspond to your answer(s) in part (c).] The substitution effect suggests that there exists a positive relationship between the wage rate and hours worked. Because more can be earned by working an additional hour now that wages have increased, the opportunity cost of consuming leisure has increased, thus reducing the demand for it. The income effect states that this wage increase has caused total income/wealth to increase, and since leisure is a normal good, more will be demanded when people have more money on which to spend it. Thus, in this case, the demand for leisure will increase, and the income effect predicts fewer hours will be spend working. The income and substitution effects do not agree, but since H* did increase (from 16 - 104), the substitution effect dominates Larry’s decision, as illustrated above. Page 4 of 4
