Graphing with Excel
advertisement
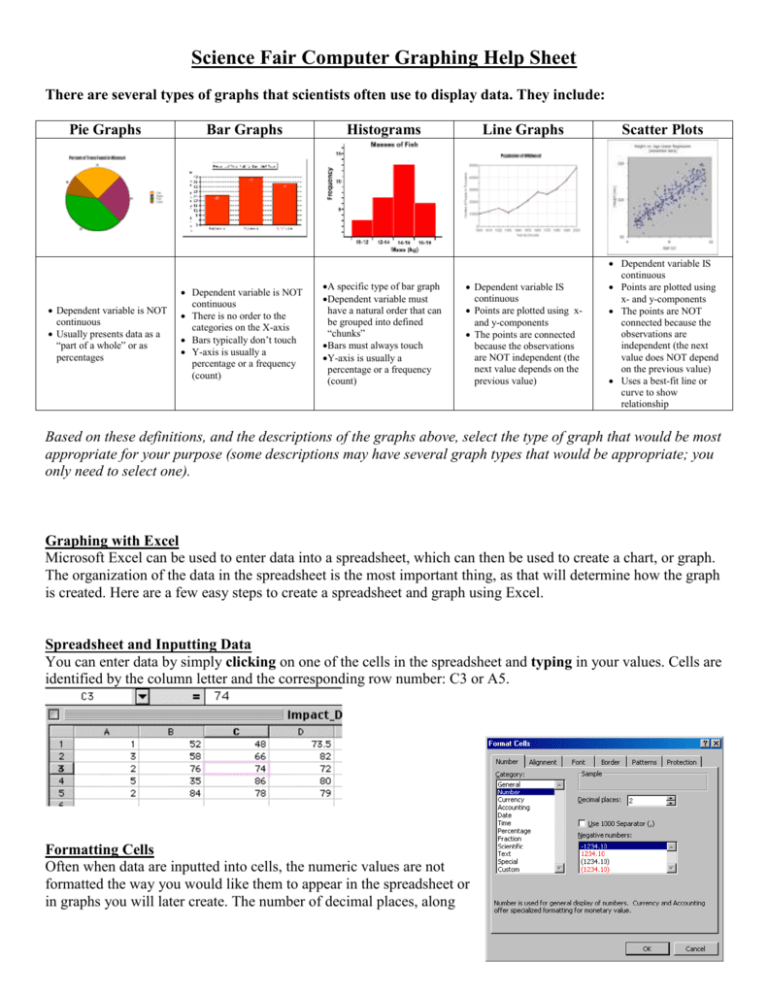
Science Fair Computer Graphing Help Sheet There are several types of graphs that scientists often use to display data. They include: Pie Graphs Dependent variable is NOT continuous Usually presents data as a “part of a whole” or as percentages Bar Graphs Dependent variable is NOT continuous There is no order to the categories on the X-axis Bars typically don’t touch Y-axis is usually a percentage or a frequency (count) Histograms A specific type of bar graph Dependent variable must have a natural order that can be grouped into defined “chunks” Bars must always touch Y-axis is usually a percentage or a frequency (count) Line Graphs Scatter Plots Dependent variable IS continuous Points are plotted using xand y-components The points are connected because the observations are NOT independent (the next value depends on the previous value) Dependent variable IS continuous Points are plotted using x- and y-components The points are NOT connected because the observations are independent (the next value does NOT depend on the previous value) Uses a best-fit line or curve to show relationship Based on these definitions, and the descriptions of the graphs above, select the type of graph that would be most appropriate for your purpose (some descriptions may have several graph types that would be appropriate; you only need to select one). Graphing with Excel Microsoft Excel can be used to enter data into a spreadsheet, which can then be used to create a chart, or graph. The organization of the data in the spreadsheet is the most important thing, as that will determine how the graph is created. Here are a few easy steps to create a spreadsheet and graph using Excel. Spreadsheet and Inputting Data You can enter data by simply clicking on one of the cells in the spreadsheet and typing in your values. Cells are identified by the column letter and the corresponding row number: C3 or A5. Formatting Cells Often when data are inputted into cells, the numeric values are not formatted the way you would like them to appear in the spreadsheet or in graphs you will later create. The number of decimal places, along with many other formatting options can be set by selecting the cell or cells you would like to format and choosing Format>Cells... When you first click on the Number tab, your cells will be listed in the Category General. This is the default data category for a new spreadsheet. To control the decimal places, you will need to change the Category to Number. Sometimes when numbers are entered into cells, they are changed to dates, or sometimes you will need data to have 2 decimals. To make any formatting changes in the data, use the format cells option. NOTE: Setting up the data correctly is the most important aspect in obtaining a graph that adequately reflects the data. Creating a Bar Graph With One Independent Variable The independent variable is placed in the first column while the dependent variable is placed in the second column. The headers at the top of each column are not necessary, but they do help identify the variables. Do not include labels like inches or degrees in the individual cells. Those labels should be at the top of the column. Excel cannot graph words. Highlight all data in the cells and start the Chart Wizard from the toolbar: Choose the Column Chart type and the Chart subtype in the upper left corner (basic bar graph). This chart type creates a vertical bar graph, which Excel refers to as a Column chart. If you want to create a horizontal bar graph, choose the Bar chart type. Click Next when you are done. Confirm that your Data Series are in Columns in your spreadsheet. Your Data range should reflect your selection of the independent and dependent data (plus possibly your column headers) in absolute cell references. The preview should show a pretty good representation of what your chart will look like. Click Next when you are done Next you will see the place where you enter a title for the graph and enter labels for the X-axis and the Y-axis. You will be able to see these labels right on the preview. Click Next when you are done. Your final graph should look like this: Creating a Bar Graph With Two Independent Variables A multiple bar graph depicting data using two independent variables is created in the same way as a simple bar graph. However note the additional column headings needed for additional independent variables. Some things to note when creating this multiple bar graph: The first independent variable, Mammal, is still in the first column, with the dependent variable values (Count) in columns two and three. The second and third columns represent dependent variable values at two different levels of the second independent variable, Week. Make sure to select all of the data when creating the graph. The Chart wizard will automatically recognize you have a second independent variable. Creating Pie Charts, Line Graphs, or Scatter Plots These types of graphs can be creating using the same instructions for bar graphs on the previous pages. Just select the appropriate chart type from the Chart Wizard (see below). Note: Editing the chart type after this step should be similar to the example listed previously.

