Math Graph Project
advertisement
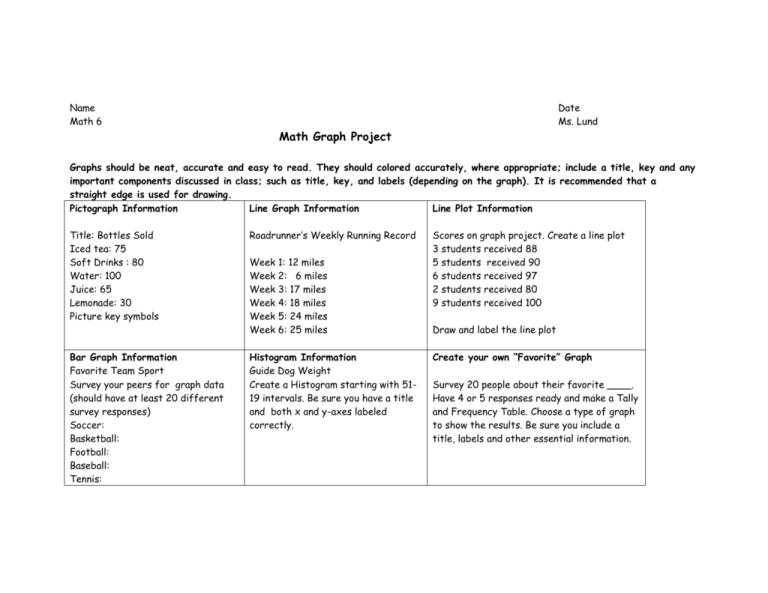
Name Math 6 Date Ms. Lund Math Graph Project Graphs should be neat, accurate and easy to read. They should colored accurately, where appropriate; include a title, key and any important components discussed in class; such as title, key, and labels (depending on the graph). It is recommended that a straight edge is used for drawing. Pictograph Information Line Graph Information Line Plot Information Title: Bottles Sold Iced tea: 75 Soft Drinks : 80 Water: 100 Juice: 65 Lemonade: 30 Picture key symbols Bar Graph Information Favorite Team Sport Survey your peers for graph data (should have at least 20 different survey responses) Soccer: Basketball: Football: Baseball: Tennis: Roadrunner’s Weekly Running Record Week Week Week Week Week Week 1: 12 miles 2: 6 miles 3: 17 miles 4: 18 miles 5: 24 miles 6: 25 miles Histogram Information Guide Dog Weight Create a Histogram starting with 5119 intervals. Be sure you have a title and both x and y-axes labeled correctly. Scores on graph project. Create a line plot 3 students received 88 5 students received 90 6 students received 97 2 students received 80 9 students received 100 Draw and label the line plot Create your own “Favorite” Graph Survey 20 people about their favorite ____. Have 4 or 5 responses ready and make a Tally and Frequency Table. Choose a type of graph to show the results. Be sure you include a title, labels and other essential information.

