2000 SEI Funds and Portfolio Capital Gains Estimates as of 6/30/00
advertisement

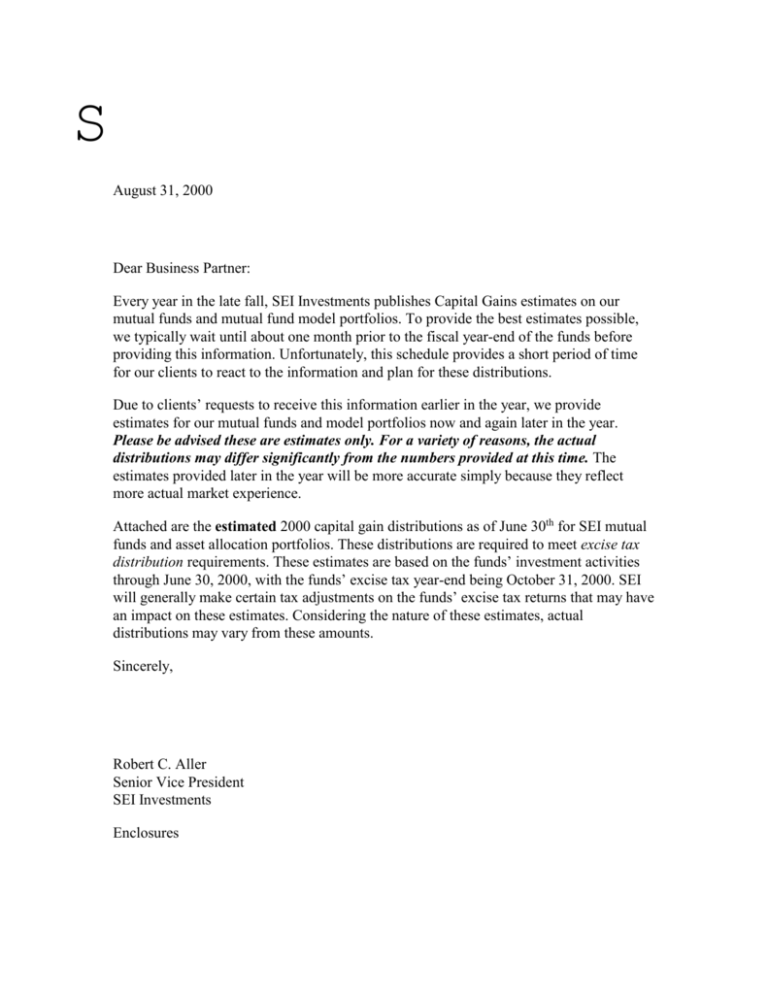
S August 31, 2000 Dear Business Partner: Every year in the late fall, SEI Investments publishes Capital Gains estimates on our mutual funds and mutual fund model portfolios. To provide the best estimates possible, we typically wait until about one month prior to the fiscal year-end of the funds before providing this information. Unfortunately, this schedule provides a short period of time for our clients to react to the information and plan for these distributions. Due to clients’ requests to receive this information earlier in the year, we provide estimates for our mutual funds and model portfolios now and again later in the year. Please be advised these are estimates only. For a variety of reasons, the actual distributions may differ significantly from the numbers provided at this time. The estimates provided later in the year will be more accurate simply because they reflect more actual market experience. Attached are the estimated 2000 capital gain distributions as of June 30th for SEI mutual funds and asset allocation portfolios. These distributions are required to meet excise tax distribution requirements. These estimates are based on the funds’ investment activities through June 30, 2000, with the funds’ excise tax year-end being October 31, 2000. SEI will generally make certain tax adjustments on the funds’ excise tax returns that may have an impact on these estimates. Considering the nature of these estimates, actual distributions may vary from these amounts. Sincerely, Robert C. Aller Senior Vice President SEI Investments Enclosures SEI Asset Allocation Portfolios For your planning purposes, a hypothetical $1 million account would pay the following estimated capital gain distributions for the SEI Asset Allocation portfolios listed below: Asset Allocation Portfolio ATM 100 ATM 80 ATM 60 ATM 40 ATM 100ex ATM 80ex ATM 60ex ATM 40ex TM 100 TM 80 TM 60 TM 40 Institutional Equity Institutional Capital Growth Inst. Growth & Income Institutional Moderate G&I Institutional Fixed Income Global Equity Global Capital Growth Global Growth & Income Global Moderate G&I Domestic Equity Capital Growth Growth & Income Moderate G&I Conservative G&I Current Income Capital Preservation 2000 YTD Estimated Short-Term Gain Distribution $5,644 5,769 5,745 5,721 2,883 619 415 431 26,946 22,645 16,580 10,514 23,633 19,408 16,820 12,409 3,550 21,377 17,088 12,931 8,775 17,288 14,190 11,187 6,286 4,667 --- 2000 YTD Estimated Long-Term Gain Distribution $20,301 16,107 11,900 7,692 15,218 11,394 8,169 4,897 18,486 15,216 11,238 7,261 31,427 24,037 16,509 8,709 -28,235 21,144 14,112 7,079 25,460 18,776 11,854 4,066 812 --- — For Financial Intermediary Use Only. Not for Public Distribution. — SEI Mutual Funds SEI Fund Tax Managed Large Cap 2000 Estimated ShortTerm Gain (per share) $ -- 2000 Estimated LongTerm Gain (per share) $ 0.06 Large Cap Growth Large Cap Value Small Cap Growth Small Cap Value S&P 500 Index International Equity Emerging Markets Equity 0.68 -5.59 0.22 -0.48 0.53 1.31 0.24 2.24 0.02 -0.52 0.67 Core Fixed Income High Yield Bond Intermediate Municipal International Fixed Income Emerging Markets Debt ---0.02 0.30 ---0.01 0.02 ---- ---- 0.12 -0.12 -- 2.71 2.17 0.39 0.32 California Municipal Massachusetts Municipal Pennsylvania Municipal Capital Appreciation Equity Income Mid Cap Balanced Note: the above capital gain estimates are based on the fund's investment activities through June 30, 2000. Certain tax adjustments are generally made on the fund's excise tax returns that may have a material impact on the dividends. Based on these adjustments and activity through October 31, 2000, the actual distributions may vary significantly from the above amounts. — For Financial Intermediary Use Only. Not for Public Distribution. —


