Problem Set #1 Key
advertisement
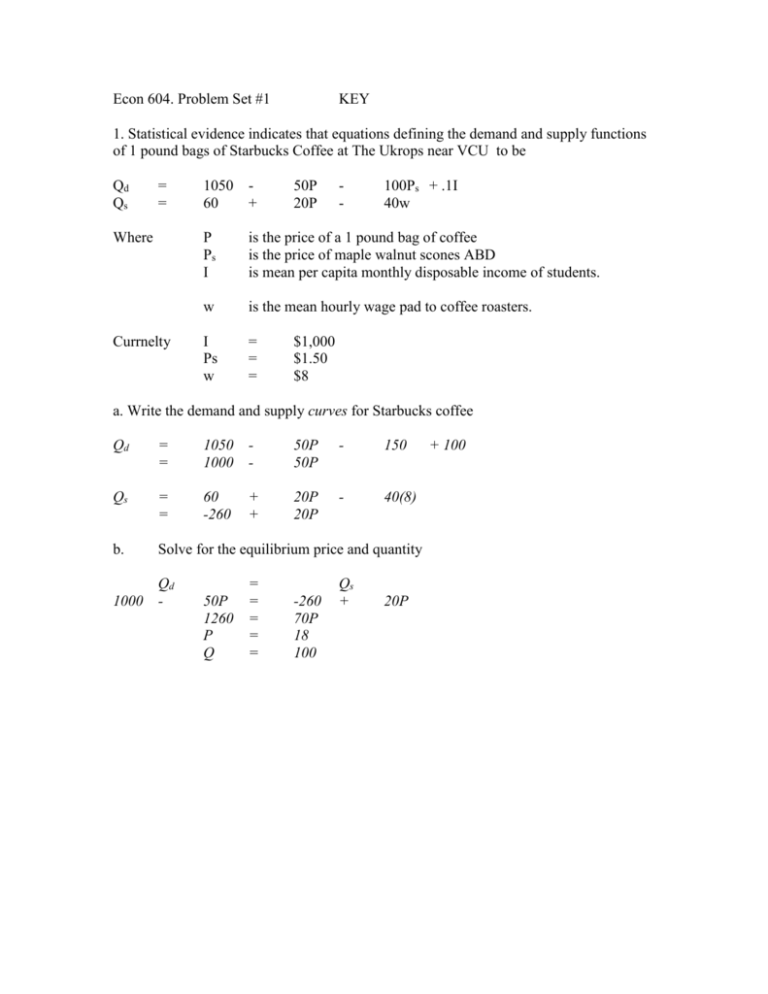
Econ 604. Problem Set #1 KEY 1. Statistical evidence indicates that equations defining the demand and supply functions of 1 pound bags of Starbucks Coffee at The Ukrops near VCU to be Qd Qs = = Where Currnelty 1050 60 + 50P 20P - 100Ps + .1I 40w P Ps I is the price of a 1 pound bag of coffee is the price of maple walnut scones ABD is mean per capita monthly disposable income of students. w is the mean hourly wage pad to coffee roasters. I Ps w = = = $1,000 $1.50 $8 a. Write the demand and supply curves for Starbucks coffee Qd = = 1050 1000 - 50P 50P - 150 Qs = = 60 -260 + + 20P 20P - 40(8) b. Solve for the equilibrium price and quantity Qd 1000 - 50P 1260 P Q = = = = = -260 70P 18 100 Qs + 20P + 100 c. Graph your solution. Inverse supply and demand are Ps = (Qs + 260)/20 = (1000 - Qd)/50 and Pd 24 22 Price 20 18 16 14 12 10 0 50 100 150 200 250 Quantity Suppose that Starbucks employees negotiate a $2 per hour wage increase. d. Find the new supply curve Qs = 60 + 20P = -340 + 20P - 40(10) e. Find the new equilibrium Qd 1000 - 50P 1340 P Q = = = = = Qs -340 + 70P 19.14 42.86 20P f. Graph the change on your chart. New inverse supply is Ps = Qs/20 +17. Plotting as the dashed line, Price 24 22 20 18 16 14 12 10 0 50 100 150 Quantity 200 250 g. Analyze the changes. When did a change in supply occur? When did a change in quantity supplied occur? The upward shift of the supply curve in response to the wage increase represents a change in supply. Quantity supply adjusts with price movements from the initial equilibrium to the new one. 2. Suppose that a society’s conditions of medical care and military goods is given by the equation 3X2 + 2Y2 = 100 where X represents Bradley fighting vehicles and Y represents doctors trained. a. Graph this relationship. In your chare illustrate the following - Inefficient points and efficient by unattainable points - Increasing marginal opportunity cost Unattainable 8 7 6 Increasing Marginal Opportunity Costs 5 4 3 2 Inefficent 1 0 0 2 4 6 8 b. Find the slope of the above expression. Use it to analytically illustrate the notion of increasing marginal opportunity costs. Y = dY = dY/dX = ((100 – 3X2)/2)1/2 (½)((100 – 3X2)/2)-1/2(-3X)dX (-1.5X)/Y When X = 1, Y = 6.956, so dY/dX = -.215 When X = 2, Y = 6.63, so dY/dX = -.452 When X = 3, Y = 6.04, so dY/dX = -.75 And so on. In general, constant increments of X require society to give up increasing increments of Y. c. Suppose that the right hand side of the above expression increased to 200. What effect would that have on your production possibilities frontier? What economic explanation might motivate such a change? The entire curve would shift out. A technological development may motivate such a change. 2.2. If we cut four congruent squares out of the corners of a square piece of cardboard 12 inches on a side, we can fold up the four remaining flaps to obtain a tray without a top. What size square should be cut in order to maximize the volume of the tray? Volume = lwh. Here we set h=l. Thus we maximize h (12-2h)2 h(144 – 24h +4h2) 144h -24h2 + 4h3 Taking FONC 144 – 48h + 12h2 =0 Dividing 12 -4h +h2 (6-h)(2-h) Roots are 6 and 2. But from second order condition -48 + 24h We see that the expression is negative only for h=2. Area is 2(8)(8) = 128 2.7 Suppose a firm’s total revenues depend on the amount produced (q) according to the function TR = 70q – q2 Total costs also depend on q: TC = q2 + 30q + 100 a. What level of output should the firm produce in order to maximize profits (TR-TC)? = = TR 70q-q2 d/dq = 70-2q Thus 40 – 4q q=10 - TC (q2 + 30q + 100) = 2q-30 = 0 0 b. Show that the second-order conditions for a maximum are satisfied at the output level found in part (a) d2/dq2= -4 <0. Thus a maximum c. Does the solution calculated here obey the “marginal revenue equals marginal cost” rule? Explain Yes, MR MC = = 70-2q and 2q+30
