BT.1358 - Studio parameters of 625 and 525 line progressive
advertisement
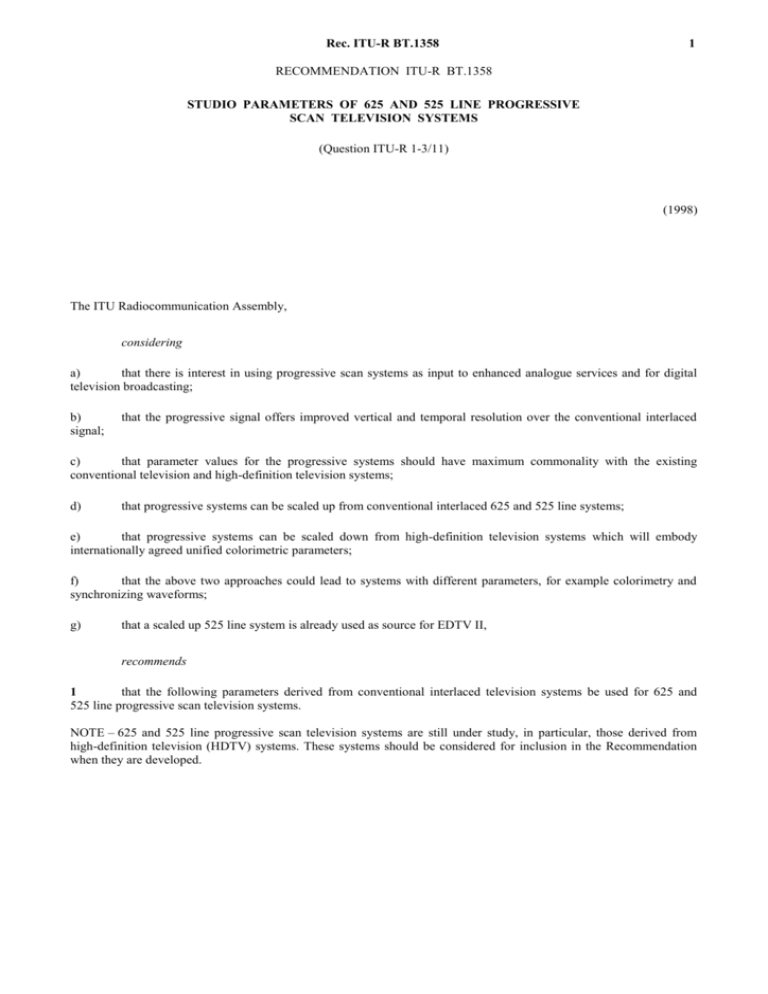
Rec. ITU-R BT.1358 1 RECOMMENDATION ITU-R BT.1358 STUDIO PARAMETERS OF 625 AND 525 LINE PROGRESSIVE SCAN TELEVISION SYSTEMS (Question ITU-R 1-3/11) (1998) Rec. ITU-R BT.1358 The ITU Radiocommunication Assembly, considering a) that there is interest in using progressive scan systems as input to enhanced analogue services and for digital television broadcasting; b) signal; that the progressive signal offers improved vertical and temporal resolution over the conventional interlaced c) that parameter values for the progressive systems should have maximum commonality with the existing conventional television and high-definition television systems; d) that progressive systems can be scaled up from conventional interlaced 625 and 525 line systems; e) that progressive systems can be scaled down from high-definition television systems which will embody internationally agreed unified colorimetric parameters; f) that the above two approaches could lead to systems with different parameters, for example colorimetry and synchronizing waveforms; g) that a scaled up 525 line system is already used as source for EDTV II, recommends 1 that the following parameters derived from conventional interlaced television systems be used for 625 and 525 line progressive scan television systems. NOTE – 625 and 525 line progressive scan television systems are still under study, in particular, those derived from high-definition television (HDTV) systems. These systems should be considered for inclusion in the Recommendation when they are developed. 2 Rec. ITU-R BT.1358 ANNEX 1 Signal parameter values for 625/50/1:1 and 525/59.94/1:1 progressive scanning systems derived from conventional 625 and 525 line standards 1 Opto-electronic conversion Characteristics Item 1.1 Parameter Chromaticity coordinates, CIE 1931(1) Primaries 1.2 525/59.94/1:1 x y x y Red 0.640 0.330 0.630 0.340 Green 0.290 0.600 0.310 0.595 Blue 0.150 0.060 0.155 0.070 Assumed chromaticity for equal primary signals - Reference white ER EG EB (1) 625/50/1:1 1.3 Opto-electronic transfer characteristics before non-linear precorrection 1.4 Overall opto-electronic transfer characteristic at source D65 x y 0.3127 0.3290 Assumed linear E (1.099 L0.45 – 0.099) for 1.00 L 0.018 E 4.500 L for 0.018 L 0 where: L: luminance of the image 0 L 1 for conventional colorimetry E: corresponding electrical signal. Chromaticity coordinates specified are those currently used by 625-line and 525-line conventional systems. NOTE – See Recommendation ITU-R BT.1361, (Worldwide unified colorimetry and related characteristics of future television and imaging systems). 2 Picture and scanning characteristics Characteristics Item (1) Parameter 625/50/1:1 525/59.94/1:1 2.1 Order of scanning Left to right, top to bottom 2.2 Scanning format 2.3 Picture rate (Hz) 50 60/1.001 2.4 Total number of lines 625 525 2.5 Active lines per picture 576 (lines 45 - 620) 483 (line 43 - 525) 2.6 Aspect ratio(1) 2.7 Line frequency (Hz) Progressive 1:1 16:9 (4:3) 31 250 0.0001% 31 500/1.001 3 ppm The aspect ratio for HDTV and EDTV applications will normally be 16:9. It is possible that progressive scanning systems will be used within standard TV (SDTV) applications with an aspect ratio of 4:3. Parameters for such systems are contained within standard parenthesis, i.e. (4:3). Rec. ITU-R BT.1358 3 3 Analogue representation , EG , EB , EY , EP (or EC ), EP (or EC ) refer to gamma pre-corrected analogue signals. The terms ER B B R R Levels are specified in millivolts measured across a matched 75 termination. Characteristics Item 3.1 Parameter 625/50/1:1 Primary signals nominal level, Standard colorimetry, 525/59.94/1:1 Reference black: 0%, 0 mV Reference peak level: 100%, 700 mV , EB : ER , EG 3.2 Derivation of luminance component signal EY (1) 3.3 Derivation of colour-difference component signals 0.114 EB EY 0.299 ER 0.587 EG EP R 3.4 Component signals nominal level, Standard and extended colorimetry, Luminance EY : Colour difference EP B , EP R : 3.5 EB EY 1.772 0.500 EB 0.169 ER 0.331 EG ER EY 1.402 0.081 EB 0.500 ER 0.419 EG EP B EP B EP R (1) Reference black: 0%, 0 mV Reference White: 100%, 700 mV No signal: 0%, 0 mV Maximum colour difference: 50%, 350 mV Nominal signal bandwidth , EB , EY ER , EG EP B , EP R 3.6 Form of synchronizing signal on primary and component signals(2) 3.7 Horizontal sync timing reference 3.8 Sync level (mV) 3.9 Inter-component timing accuracy 3.10 Horizontal sync and blanking interval signal timing 3.11 Vertical sync and blanking interval signal timing 12 MHz 6 MHz Bi-level bipolar (Fig. 1) OH (Fig. 1) –300 7.5 mV 10 ns Fig. 1 and Table 1 Fig. 2 and Tables 2 and 3 (1) The luminance and colour difference encoding equations used here are those currently recommended for conventional systems. (2) Addition of synchronizing signal on R, B, PB and PR signals is optional. 4 Rec. ITU-R BT.1358 FIGURE 1 Horizontal synchronizing pulse a b c e d f f TABLE 1 Details of horizontal synchronizing signals Symbol Characteristics H Nominal line period (s) a Horizontal blanking interval (s) 625/50/1:1 525/59.94/1:1 32 1001/31.5 (31.778) 6.0 1.5 5.35 0.15 – 0.1 b Interval between time datum (OH) and back edge of horizontal blanking pulse (s) 5.25 4.6 0.1 – 0.05 c Front porch (s) 0.75 0.15 0.75 0.05 d Synchronizing pulse (s) 2.35 0.1 2.35 0.05 e Build-up time (10 to 90%) of the edges of the horizontal blanking pulse (s) 0.15 0.05 0.07 0.01 f Build-up time (10 to 90%) of the edges of the horizontal synchronizing pulses (s) 0.1 0.05 0.07 0.01 Rec. ITU-R BT.1358 5 FIGURE 2 Vertical synchronizing pulses A B C D r p s TABLE 2 Details of vertical synchronizing signals Symbol (1) Characteristics 625/50/1:1 525/59.94/1:1 20 1001/60 (16.683) V Nominal frame period (ms) D Vertical blanking interval 49H + a(1) 42H + a(1) – Build-up time (10 to 90%) of the edges of vertical blanking pulse (s) 0.15 0.05 0.07 0.01 A Interval between front edge of vertical blanking interval and front edge of first vertical synchronizing pulse 5H(1) 6H(1) C Interval between back edge of last vertical synchronizing pulse and back edge of vertical blanking interval 39H(1) 30H(1) B Duration of sequence of vertical synchronizing pulses 5H(1) 6H(1) p Duration of vertical synchronizing pulse (s) 29.65 0.1 29.428 0.05 r Interval between vertical synchronizing pulse (s) 2.35 0.1 2.35 0.05 s Build-up time (10 to 90%) of the vertical synchronizing pulses (s) 0.1 0.05 0.07 0.01 For H and a, see Table 1. 6 Rec. ITU-R BT.1358 TABLE 3 Vertical blanking interval line numbers Line number 625/50/1:1 525/59.94/1:1 4 621 1 6 44 1 7 13 42 Digital representation The terms R, G, B, Y, CB, CR, refer to quantized and digitally encoded signals. These signals are obtained from gamma pre-corrected signals. The digital representation in the following table follows Recommendation ITU-R BT.601 Part A which defines the 4:2:2 13.5 MHz standard for 4:3 and for wide-screen 16:9 aspect ratio systems. For 16:9 aspect ratio only, Recommendation ITU-R BT.601 Part B defining a higher horizontal resolution is equally valid and the appropriate values should be substituted from Recommendation ITU-R BT.601 as required. Characteristics Item Parameter 4.1 Coded signal 4.2 Sampling lattice R, G, B, Y 4.3 Sampling lattice CB, CR, 4.4 Sampling frequency R, G, B, Y Sampling frequency CB, CR, 4.5 Number of samples per full line R, G, B, Y CB, CR 4.6 Number of samples per active line R, G, B, Y CB, CR 4.7 Coding format(1) 4.8 Quantization:(2) Primary signals R, G, B: 625/50/1:1 525/59.94/1:1 R, G, B, or Y, CB, CR Orthogonal, line and picture repetitive Orthogonal, line and picture repetitive, co-sited with odd (1st, 3rd, 5th, etc.) Y active samples in each line 27 MHz 3 ppm Half luminance sampling frequency 13.5 MHz 3 ppm 864 432 858 429 720 360 Linear, 8 or 10 bits/sample for each primary and component signal , G, B 16) 2n 8 R, G, B INT(219ER 220 or 877 quantization levels with black level at 16 or 64 and peak white level at 235 or 940, respectively Rec. ITU-R BT.1358 7 Characteristics Item Parameter 625/50/1:1 525/59.94/1:1 Quantization:(2) 4.9 Component signal Y: Component signals CB, CR: Y INT(219 EY 16) 2n 8 220 or 877 quantization levels with black level at 16 or 64 and peak white level at 235 or 940, respectively n 8 CB INT(224 E 128) 2 P B n 8 CR INT(224 E 128) 2 P R 225 or 897 quantization levels symmetrically disposed about zero signal at 128 or 512 respectively 4.10 Derivation of Y, CB, CR from quantized primary signals R, G, B:(3) 4.11 Timing relationship between analogue sync reference (OH) and video data 4.12 76.50 150.25 29.25 R G B 256 256 256 44.25 86.75 131.00 CB R G B 128.00 256 256 256 131.00 109.75 21.25 CR R G B 128.00 256 256 256 Y 132 samples @ 27 MHz 122 samples @ 27 MHz (Fig. 3) (Fig. 3) Quantization level assignment: Video data: Timing references: 4.13 1.00 through 254.75 0.00 to 0.75 and 255.00 to 255.75 Filter characteristics(4) R, G, B, Y CB, CR Fig. 4 Fig. 5 (1) To avoid confusion between 8-bit and 10-bit representations, the eight most-significant bits are considered to be an integer part while the two additional bits, if present, are considered to be fractional parts. For example, the bit pattern 10010001 would be expressed as 145d or 91h, whereas the pattern 1001000101 would be expressed as 145.25d or 91.4h. The fractional parts are shown here if valid, otherwise they are assumed to have the binary value 00. Levels are quoted for 8 and 10 bit quantization. (2) “n” denotes the number of the bit length of the quantized signal. The operator INT returns the value of 0 for fractional parts in the range of 0 to 0.49999.... and 1 for fractional parts in the range of 0.5 to 0.99999...., i.e., it rounds up fraction above 0.5. (3) Coefficients of length other than 8 or 10 may be used. (4) The filter templates are shown in Fig. 4 and Fig. 5 as a guideline. 8 Rec. ITU-R BT.1358 FIGURE 3 Timing relationship between analogue sync reference (OH) and video data 625 OH Analogue line n – 1 Analogue line n Digital line n – 1 Digital line n Digital blanking 12 T Luminance samples 717 718 719 720 721 132 T 730 731 732 733 862 863 0 1 2 4:2:2, chromo CR samples 359 360 365 366 431 0 1 359 360 365 366 491 0 1 4:2:2, chromo CB samples T : luminance sampling period 525 OH Analogue line n – 1 Analogue line n Digital line n – 1 Digital line n Digital blanking 16 T Luminance samples 717 718 719 720 721 122 T 734 735 736 737 856 857 0 1 2 4:2:2, chromo CR samples 359 360 367 368 428 0 1 359 360 367 368 428 0 1 4:2:2, chromo CB samples T : luminance sampling period 1358-03 Rec. ITU-R BT.1358 9 FIGURE 4 Filter templates for R, G, B, and Y signals 50 dB 50 40 dB 40 (dB) 30 20 12 dB 10 2 dB 0 0 100 kHz 20 15 10 11.0 13.5 16.0 12.0 5 30 MHz 25 27.0 a) Template for insertion loss (dB) 0.05 0 0.1 dB – 0.05 0 5 10 MHz 11.0 100 kHz b) Pass-band ripple tolerance (ns) 3.0 6 ns 0 – 3.0 0 100 kHz 5 10 MHz 11.0 c) Passband group-delay tolerance Note 1 – Ripple and group-delay are specified relative to values at 100 kHz. 1358-04 10 Rec. ITU-R BT.1358 FIGURE 5 Filter templates for PB, PR signals 50 dB 50 40 dB 40 (dB) 30 20 10 6 dB 0 0 100 kHz 2.5 5 7.5 5.75 6.75 8.0 10 10.5 12.5 13.5 15 MHz a) Template for insertion loss (dB) 0.05 0 0.1 dB – 0.05 0 2.5 5 MHz 11.0 100 kHz b) Pass-band ripple tolerance (ns) 3.0 6 ns 0 – 3.0 0 100 kHz 2.5 10 MHz 11.0 c) Passband group-delay tolerance Note 1 – Ripple and group-delay are specified relative to values at 100 kHz. 1358-05
