Lecture Guide: Graphical Summaries of Distributions
advertisement

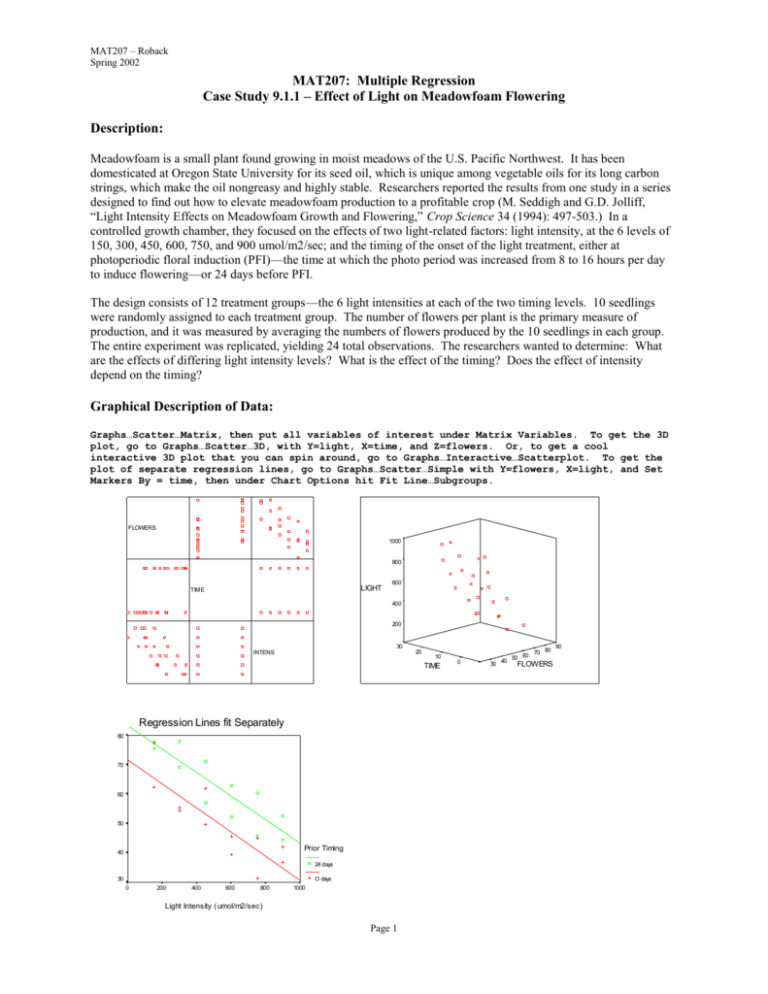
MAT207 – Roback Spring 2002 MAT207: Multiple Regression Case Study 9.1.1 – Effect of Light on Meadowfoam Flowering Description: Meadowfoam is a small plant found growing in moist meadows of the U.S. Pacific Northwest. It has been domesticated at Oregon State University for its seed oil, which is unique among vegetable oils for its long carbon strings, which make the oil nongreasy and highly stable. Researchers reported the results from one study in a series designed to find out how to elevate meadowfoam production to a profitable crop (M. Seddigh and G.D. Jolliff, “Light Intensity Effects on Meadowfoam Growth and Flowering,” Crop Science 34 (1994): 497-503.) In a controlled growth chamber, they focused on the effects of two light-related factors: light intensity, at the 6 levels of 150, 300, 450, 600, 750, and 900 umol/m2/sec; and the timing of the onset of the light treatment, either at photoperiodic floral induction (PFI)—the time at which the photo period was increased from 8 to 16 hours per day to induce flowering—or 24 days before PFI. The design consists of 12 treatment groups—the 6 light intensities at each of the two timing levels. 10 seedlings were randomly assigned to each treatment group. The number of flowers per plant is the primary measure of production, and it was measured by averaging the numbers of flowers produced by the 10 seedlings in each group. The entire experiment was replicated, yielding 24 total observations. The researchers wanted to determine: What are the effects of differing light intensity levels? What is the effect of the timing? Does the effect of intensity depend on the timing? Graphical Description of Data: Graphs…Scatter…Matrix, then put all variables of interest under Matrix Variables. To get the 3D plot, go to Graphs…Scatter…3D, with Y=light, X=time, and Z=flowers. Or, to get a cool interactive 3D plot that you can spin around, go to Graphs…Interactive…Scatterplot. To get the plot of separate regression lines, go to Graphs…Scatter…Simple with Y=flowers, X=light, and Set Markers By = time, then under Chart Options hit Fit Line…Subgroups. FLOWERS 1000 800 LIGHT TIME 600 400 200 30 INTENS 20 10 TIME Regression Lines fit Separately 80 70 60 50 Prior Timing 40 24 days 30 O days 0 200 400 600 800 1000 Light Intensity (umol/m2/sec) Page 1 0 30 80 60 70 40 50 FLOWERS 90 MAT207 – Roback Spring 2002 Regression Analysis: Analyze…Regression…Linear (Dependent = flowers; Independent = light). Model Summaryb Model 1 R .771a R Square .595 Adjusted R Square .576 Std. Error of the Estimate 8.9397 a. Predictors: (Constant), LIGHT b. Dependent Variable: FLOWERS Coefficientsa Model 1 (Constant) LIGHT Unstandardized Coefficients B Std. Error 77.385 4.161 -4.05E-02 .007 Standardi zed Coefficien ts Beta t 18.597 -5.682 -.771 Sig. .000 .000 95% Confidence Interval for B Lower Bound Upper Bound 68.755 86.015 -.055 -.026 a. Dependent Variable: FLOWERS Residual Plot for model with light only 20 10 0 -10 Prior Timing 24 days -20 0 Days 40 50 60 70 80 Unstandardized Predicted V alue Analyze…Regression…Linear (Dependent = flowers; Independent = early). Model Summaryb Model 1 R .452a R Square .204 Adjusted R Square .168 Std. Error of the Estimate 12.5245 a. Predictors: (Constant), EARLY b. Dependent Variable: FLOWERS Coefficientsa Model 1 (Constant) EARLY Unstandardized Coefficients B Std. Error 62.217 3.616 -12.158 5.113 Standardi zed Coefficien ts Beta -.452 t 17.208 -2.378 Sig. .000 .027 a. Dependent Variable: FLOWERS Page 2 95% Confidence Interval for B Lower Bound Upper Bound 54.719 69.715 -22.762 -1.554 MAT207 – Roback Spring 2002 Analyze…Regression…Linear (Dependent = flowers; Independent = light, early). Model Summaryb Descriptive Statistics FLOWERS LIGHT EARLY Mean 56.1375 525.0000 .5000 Std. Deviation 13.7334 261.6835 .5108 N 24 24 24 Model 1 R .894a R Square .799 Adjusted R Square .780 Std. Error of the Estimate 6.4411 a. Predictors: (Constant), EARLY, LIGHT b. Dependent Variable: FLOWERS Correl ations Pearson Correlation Sig. (1-tailed) N FLOW ERS LIGHT EARLY FLOW ERS LIGHT EARLY FLOW ERS LIGHT EARLY FLOW ERS 1.000 -.771 -.452 . .000 .013 24 24 24 LIGHT -.771 1.000 .000 .000 . .500 24 24 24 EARLY -.452 .000 1.000 .013 .500 . 24 24 24 Coeffi cientsa Model 1 (Const ant) LIGHT EARLY Unstandardized Coeffic ient s B St d. Error 83.464 3.274 -4. 05E-02 .005 -12.158 2.630 St andardi zed Coeffic ien ts Beta -.771 -.452 t 25.495 -7. 886 -4. 624 Sig. .000 .000 .000 95% Confidenc e Interval for B Lower Bound Upper Bound 76.656 90.272 -.051 -.030 -17.627 -6. 690 a. Dependent Variable: FLOW ERS Analyze…Regression…Linear (Dependent = flowers; Independent = day24,l300,…,l900). Model Summary Model 1 R .907a R Square .823 Adjusted R Square .761 Std. Error of the Estimate 6.7190 a. Predictors: (Constant), L900, DAY24, L750, L600, L450, L300 Coefficientsa Model 1 (Constant) DAY24 L300 L450 L600 L750 L900 Unstandardized Coefficients B Std. Error 67.196 3.629 .507 .114 -9.125 4.751 -13.375 4.751 -23.225 4.751 -27.750 4.751 -29.350 4.751 Standardi zed Coefficien ts Beta .452 -.253 -.371 -.644 -.769 -.814 t 18.518 4.432 -1.921 -2.815 -4.888 -5.841 -6.178 Sig. .000 .000 .072 .012 .000 .000 .000 a. Dependent Variable: FLOWERS Page 3 95% Confidence Interval for B Lower Bound Upper Bound 59.540 74.852 .265 .748 -19.149 .899 -23.399 -3.351 -33.249 -13.201 -37.774 -17.726 -39.374 -19.326 MAT207 – Roback Spring 2002 Analyze…Regression…Linear (Dependent = flowers; Independent = light, early, int). Transform…Compute to create int=light*early. Must first Model Summary Model 1 R .894a R Square .799 Adjusted R Square .769 Std. Error of the Estimate 6.5980 a. Predictors: (Constant), INT, LIGHT, EARLY Coeffi cientsa Model 1 (Const ant) LIGHT EARLY INT Unstandardized Coeffic ient s B St d. Error 83.147 4.343 -3. 99E-02 .007 -11.523 6.142 -1. 21E-03 .011 St andardi zed Coeffic ien ts Beta -.760 -.429 -.029 t 19.144 -5. 362 -1. 876 -.115 Sig. .000 .000 .075 .910 95% Confidenc e Interval for B Lower Bound Upper Bound 74.087 92.207 -.055 -.024 -24.336 1.289 -.023 .021 a. Dependent Variable: FLOW ERS flower 62.30 77.40 55.30 54.20 49.60 61.90 39.40 45.70 31.30 44.90 36.80 41.90 77.80 75.60 69.10 78.00 57.00 71.10 62.90 52.20 60.30 45.60 52.60 44.40 timeor 1.00 1.00 1.00 1.00 1.00 1.00 1.00 1.00 1.00 1.00 1.00 1.00 2.00 2.00 2.00 2.00 2.00 2.00 2.00 2.00 2.00 2.00 2.00 2.00 light 150.00 150.00 300.00 300.00 450.00 450.00 600.00 600.00 750.00 750.00 900.00 900.00 150.00 150.00 300.00 300.00 450.00 450.00 600.00 600.00 750.00 750.00 900.00 900.00 day24 .00 .00 .00 .00 .00 .00 .00 .00 .00 .00 .00 .00 1.00 1.00 1.00 1.00 1.00 1.00 1.00 1.00 1.00 1.00 1.00 1.00 early 1.00 1.00 1.00 1.00 1.00 1.00 1.00 1.00 1.00 1.00 1.00 1.00 .00 .00 .00 .00 .00 .00 .00 .00 .00 .00 .00 .00 time .00 .00 .00 .00 .00 .00 .00 .00 .00 .00 .00 .00 24.0 24.0 24.0 24.0 24.0 24.0 24.0 24.0 24.0 24.0 24.0 24.0 l150 1.00 1.00 .00 .00 .00 .00 .00 .00 .00 .00 .00 .00 1.00 1.00 .00 .00 .00 .00 .00 .00 .00 .00 .00 .00 Page 4 l300 .00 .00 1.00 1.00 .00 .00 .00 .00 .00 .00 .00 .00 .00 .00 1.00 1.00 .00 .00 .00 .00 .00 .00 .00 .00 l450 .00 .00 .00 .00 1.00 1.00 .00 .00 .00 .00 .00 .00 .00 .00 .00 .00 1.00 1.00 .00 .00 .00 .00 .00 .00 l600 .00 .00 .00 .00 .00 .00 1.00 1.00 .00 .00 .00 .00 .00 .00 .00 .00 .00 .00 1.00 1.00 .00 .00 .00 .00 l750 .00 .00 .00 .00 .00 .00 .00 .00 1.00 1.00 .00 .00 .00 .00 .00 .00 .00 .00 .00 .00 1.00 1.00 .00 .00 l900 .00 .00 .00 .00 .00 .00 .00 .00 .00 .00 1.00 1.00 .00 .00 .00 .00 .00 .00 .00 .00 .00 .00 1.00 1.00 int 150.00 150.00 300.00 300.00 450.00 450.00 600.00 600.00 750.00 750.00 900.00 900.00 .00 .00 .00 .00 .00 .00 .00 .00 .00 .00 .00 .00


