week 3
advertisement
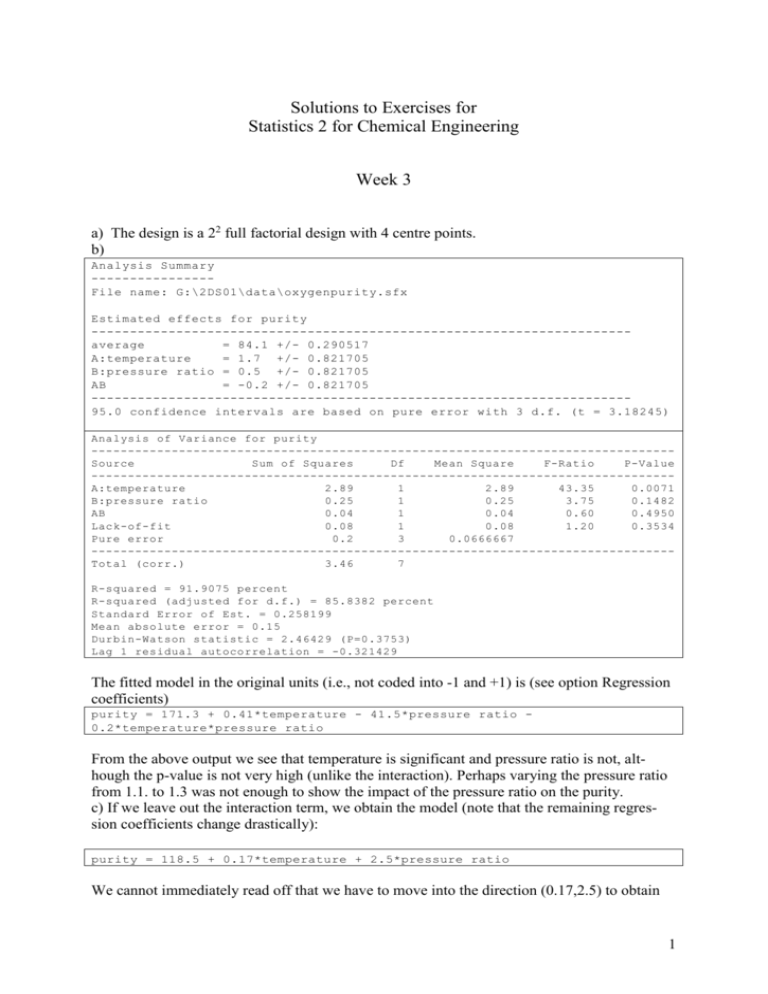
Solutions to Exercises for Statistics 2 for Chemical Engineering Week 3 a) The design is a 22 full factorial design with 4 centre points. b) Analysis Summary ---------------File name: G:\2DS01\data\oxygenpurity.sfx Estimated effects for purity ---------------------------------------------------------------------average = 84.1 +/- 0.290517 A:temperature = 1.7 +/- 0.821705 B:pressure ratio = 0.5 +/- 0.821705 AB = -0.2 +/- 0.821705 ---------------------------------------------------------------------95.0 confidence intervals are based on pure error with 3 d.f. (t = 3.18245) Analysis of Variance for purity -------------------------------------------------------------------------------Source Sum of Squares Df Mean Square F-Ratio P-Value -------------------------------------------------------------------------------A:temperature 2.89 1 2.89 43.35 0.0071 B:pressure ratio 0.25 1 0.25 3.75 0.1482 AB 0.04 1 0.04 0.60 0.4950 Lack-of-fit 0.08 1 0.08 1.20 0.3534 Pure error 0.2 3 0.0666667 -------------------------------------------------------------------------------Total (corr.) 3.46 7 R-squared = 91.9075 percent R-squared (adjusted for d.f.) = 85.8382 percent Standard Error of Est. = 0.258199 Mean absolute error = 0.15 Durbin-Watson statistic = 2.46429 (P=0.3753) Lag 1 residual autocorrelation = -0.321429 The fitted model in the original units (i.e., not coded into -1 and +1) is (see option Regression coefficients) purity = 171.3 + 0.41*temperature - 41.5*pressure ratio 0.2*temperature*pressure ratio From the above output we see that temperature is significant and pressure ratio is not, although the p-value is not very high (unlike the interaction). Perhaps varying the pressure ratio from 1.1. to 1.3 was not enough to show the impact of the pressure ratio on the purity. c) If we leave out the interaction term, we obtain the model (note that the remaining regression coefficients change drastically): purity = 118.5 + 0.17*temperature + 2.5*pressure ratio We cannot immediately read off that we have to move into the direction (0.17,2.5) to obtain 1 the path of steepest ascent. We first have to rewrite the model into the coded variables (temp220)/5 and (pressure ratio-1.2)/0.1 . This yields 0.85 and 0.25 as regression coefficients. Hence, the direction of steepest ascent in the coded variables equals (0.85;0.25). We could also obtain this direction from the effect estimates in the Analysis Summary, since effect estimates equal twice the regression coefficients. The computation for the model with interaction term yields the same answer at the point (0,0), i.e. at the centre point (compute partial derivatives). However, there is a different answer in the original units. A numerical example is given in part d). An increase in temperature of 10 C corresponds to an increase of 2 in the coded variable. Hence, the corresponding increase of coded variable for pressure ratio in the steepest ascent direction equals 0.25*2/0.85 = 0.589. The increase in the original units thus equals 0.589*0.1 = 0.0589. Path of Steepest Ascent for purity temperatur ----------220.0 -210.0 pressure r ---------1.2 1.25882 Predicted purity -----------84.1 85.9471 Path of Steepest Ascent for purity temperatur ----------220.0 -186.0 pressure r ---------1.2 1.4 Predicted purity -----------84.1 90.38 Path of Steepest Ascent for model without interaction term. Path of Steepest Ascent for purity temperatur ----------220.0 -210.0 pressure r ---------1.2 1.23724 Predicted purity -----------84.1 85.8186 Path of Steepest Ascent for purity temperatur ----------220.0 -197.923 pressure r ---------1.2 1.4 Predicted purity -----------84.1 87.4701 Path of Steepest Ascent for model with interaction term. We observe that it does make a difference whether the interaction term is used. 2. a) The design is a Central Composite Design (runs 5 through 8 are axial points). b) Analysis Summary ---------------File name: G:\2DS01\data\filtration.sfx Estimated effects for filtration time ---------------------------------------------------------------------average = 41.2 +/- 2.3884 A:temperature = -3.93935 +/- 3.77639 B:pressure = 2.91423 +/- 3.7764 AA = 7.42498 +/- 4.04973 AB = 12.0 +/- 5.34062 BB = 4.925 +/- 4.04978 ---------------------------------------------------------------------95.0 confidence intervals are based on pure error with 4 d.f. (t = 2.77645) 2 Analysis of Variance for filtration time -------------------------------------------------------------------------------Source Sum of Squares Df Mean Square F-Ratio P-Value -------------------------------------------------------------------------------A:temperature 31.0369 1 31.0369 8.39 0.0443 B:pressure 16.9853 1 16.9853 4.59 0.0988 AA 95.8782 1 95.8782 25.91 0.0070 AB 144.0 1 144.0 38.92 0.0034 BB 42.1824 1 42.1824 11.40 0.0279 Lack-of-fit 139.604 3 46.5348 12.58 0.0167 Pure error 14.8 4 3.7 -------------------------------------------------------------------------------Total (corr.) 470.0 12 R-squared = 67.148 percent R-squared (adjusted for d.f.) = 43.6823 percent Note that pressure is not significant, but pressure^2 is significant (this is counter-intuitive, but may happen) and that there is a significant lack-of-fit and a low R2. This means that we should look for a better model. However, the design at hand does not allow to fit higher-order models. Therefore we proceed the analysis with the above factors, although in practice further experimentation is required at this stage. The fitted model in the original units (i.e., not coded into -1 and +1) is (see option Regression coefficients) filtration time = 1332.25 - 14.052*temperature - 744.674*pressure + 0.0371249*temperature^2 + 4.0*temperature*pressure + 109.444*pressure^2 The regression coefficients in the coded variables (temp-60)/10 and (pressure-2.35)/.15 can be obtained from the effect estimates by dividing them by 2. c) The plot below seems to indicate that the fitted model has a true local minimum. filtration time Estimated Response Surface 55 52 49 46 43 40 37 50 54 58 62 66 temperature 70 2.5 2.4 2.3 2.2 pressure The contour plot confirms this, but also shows that the true minimum is far away (possibly 3 with a negative optimal value for pressure, which is impossible of course). This casts extra doubt on our model. Moreover, it is always dangerous to extrapolate, i.e. to draw inferences about the response variable outside the experimental region. pressure Contours of Estimated Response Surface 2.5 2.25 2 1.75 1.5 1.25 1 0.75 0.5 0.25 0 -0.25 -0.5 -0.75 -1 filtration time 40.0 45.0 50.0 55.0 60.0 50 75 100 125 150 175 200 temperature 6 1 7.42 . Matlab shows that the ei4.925 2 6 genvalues are both positive, confirming that the stationary point is a minimum. Note that all values are for the coded variables. Using the effect estimates, the B matrix equals >> B= [7.42/2 6/2;6/2 4.925/2] B= 3.712 3 3 2.4625 >> eig(B) ans = 0.0229 6.1516 d) = e) Note that the matrix is in terms of the coded variables. 4 b=[-3.9395/2;2.91423/2] b= -1.9697 1.4571 >> -.5*inv(B)*b ans = 33.935 -41.638 The stationary point in the original units equals 10*33.935+60=399 °C en -41.638*.15+2.35 = -3.88. This point is clearly not in the experimental region. Statgraphics gives optimal values over the experimental region (see example below): Optimize Response -----------------------Goal: minimize filtration time Optimum value = 36.7037 Factor Low High Optimum -------------------------------------------------------------------------------------------------temperature 45.8579 74.1421 74.078 pressure 2.13787 2.56213 2.13787 f) Maintaining the filtration time at 45.0, we get the following results: Optimize Response ----------------Goal: maintain filtration time at 45.0 Optimum value = 45.0 Factor Low High Optimum ----------------------------------------------------------------------temperature 45.8579 74.1421 49.4621 pressure 2.13787 2.56213 2.5051 3. a) The design consists of points on the cube with vertices (175±25, 7.5±2.5, 20±5) but no corner points. For example there is no design point (175, 7.5,15). Since some design points are in the middle of an edge, the design is a Box-Behnken design. b) 5 Estimated effects for viscosity ---------------------------------------------------------------------average = 624.0 +/- 47.948 A:temperature = 18.75 +/- 58.724 B:agitation rate = 55.25 +/- 58.724 C:pressure = -52.0 +/- 58.724 AA = -150.0 +/- 86.4394 AB = -39.0 +/- 83.0483 AC = 218.5 +/- 83.0483 BB = 39.0 +/- 86.4394 BC = 35.5 +/- 83.0483 CC = -71.5 +/- 86.4394 ---------------------------------------------------------------------95.0 confidence intervals are based on total error with 5 d.f. (t = 2.57059) Analysis of Variance for viscosity -------------------------------------------------------------------------------Source Sum of Squares Df Mean Square F-Ratio P-Value -------------------------------------------------------------------------------A:temperature 703.125 1 703.125 0.95 0.4327 B:agitation rate 6105.13 1 6105.13 8.24 0.1030 C:pressure 5408.0 1 5408.0 7.30 0.1141 AA 20769.2 1 20769.2 28.03 0.0339 AB 1521.0 1 1521.0 2.05 0.2883 AC 47742.3 1 47742.3 64.43 0.0152 BB 1404.0 1 1404.0 1.89 0.3025 BC 1260.25 1 1260.25 1.70 0.3221 CC 4719.0 1 4719.0 6.37 0.1276 Lack-of-fit 3736.75 3 1245.58 1.68 0.3941 Pure error 1482.0 2 741.0 -------------------------------------------------------------------------------Total (corr.) 94871.3 14 R-squared = 94.4991 percent R-squared (adjusted for d.f.) = 84.5976 percent c) The plots below show that the fitted model has a saddle point. Estimated Response Surface viscosity pressure=20.0 690 660 630 600 570 540 9 10 8 510 7 6 150 160 170 180 190 200 5 agitation rate temperature 6 Contours of Estimated Response Surface pressure=20.0 agitation rate 10 viscosity 510.0 528.0 546.0 564.0 582.0 600.0 618.0 636.0 654.0 9 8 7 6 5 672.0 150 160 170 180 190 200 temperature In order to confirm our graphical impression about the saddlepoint (which are plots are a fixed value of pressure), we perform a matrix analysis. The eigenvalues do not all have the same sign, which confirms our graphical impression. B= [-150/2 -39/4 218.5/4; -39/4 39/2 35.5/4; 218.5/4 35.5/4 -71.5/2] B= -75.0 -9.7500 54.6250 -9.7500 19.5000 8.8750 54.6250 8.8750 -35.7500 >> eig(B) ans = -114.6936 2.5208 20.9229 d) + e) Since the stationary point is a saddlepoint, it does not make sense to look for setting that maximise viscosity f) Optimize Response ----------------Goal: maintain viscosity at 600.0 Optimum value = 600.0 Factor Low High Optimum ----------------------------------------------------------------------temperature 150.0 200.0 173.838 agitation rate 5.0 10.0 6.46598 pressure 15.0 25.0 21.5161 7
