Chapter 14: Homework Answers
advertisement
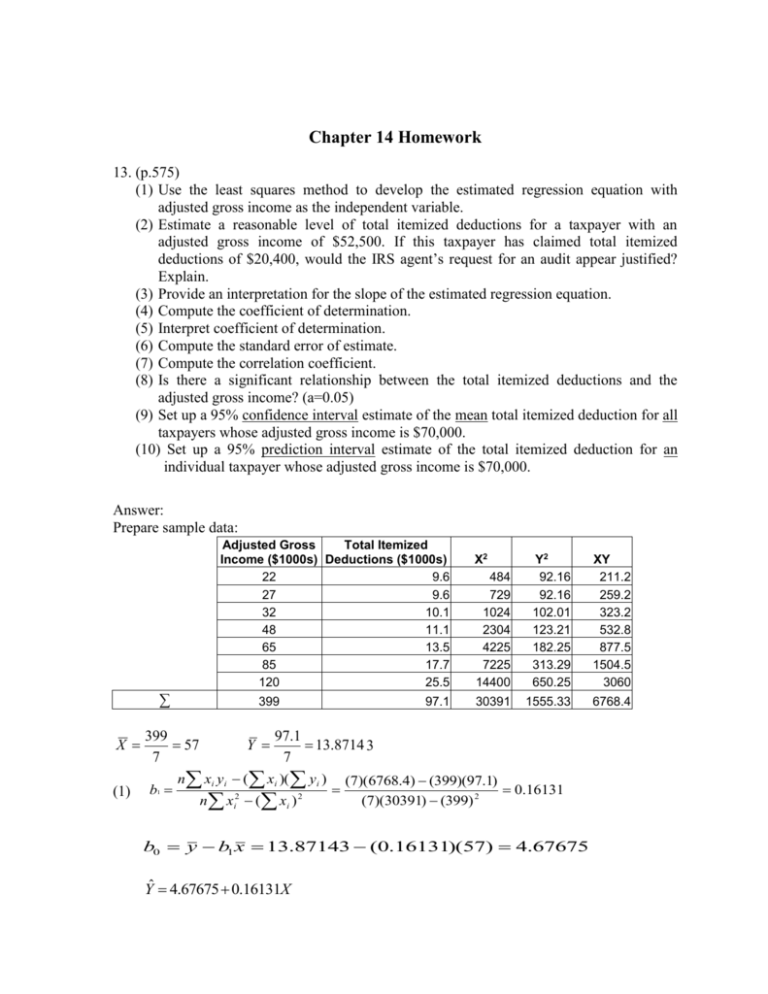
Chapter 14 Homework 13. (p.575) (1) Use the least squares method to develop the estimated regression equation with adjusted gross income as the independent variable. (2) Estimate a reasonable level of total itemized deductions for a taxpayer with an adjusted gross income of $52,500. If this taxpayer has claimed total itemized deductions of $20,400, would the IRS agent’s request for an audit appear justified? Explain. (3) Provide an interpretation for the slope of the estimated regression equation. (4) Compute the coefficient of determination. (5) Interpret coefficient of determination. (6) Compute the standard error of estimate. (7) Compute the correlation coefficient. (8) Is there a significant relationship between the total itemized deductions and the adjusted gross income? (a=0.05) (9) Set up a 95% confidence interval estimate of the mean total itemized deduction for all taxpayers whose adjusted gross income is $70,000. (10) Set up a 95% prediction interval estimate of the total itemized deduction for an individual taxpayer whose adjusted gross income is $70,000. Answer: Prepare sample data: Adjusted Gross Total Itemized Income ($1000s) Deductions ($1000s) 22 9.6 27 9.6 32 10.1 48 11.1 65 13.5 85 17.7 120 25.5 ∑ X (1) 399 399 57 7 b1 Y 97.1 X2 484 729 1024 2304 4225 7225 14400 Y2 92.16 92.16 102.01 123.21 182.25 313.29 650.25 XY 211.2 259.2 323.2 532.8 877.5 1504.5 3060 30391 1555.33 6768.4 97.1 13.8714 3 7 n xi yi ( xi )( yi ) n x ( xi ) 2 i 2 (7)(6768.4) (399)(97.1) 0.16131 (7)(30391) (399) 2 b0 y b1 x 13.87143 (0.16131)(57) 4.67675 Yˆ 4.67675 0.16131X (2) Given X = 52.5 ($52,500), Yˆ 4.67675 (0.16131)(52.5) 13.14553 ($13,145.53). If this taxpayer has claimed total itemized deductions of $20,400, the agent’s request for an audit appears to be justified. (3) For each increase of $1,000 adjusted gross income (one unit of X), the expected total itemized deduction (Y) is estimated to increase by an average of $161.31 (0.16131 units of Y). [ xi y i ( xi y i ) / n] 2 [6768.4 (399)(97.1) / 7] 2 SSR 199.0083 (4) 2 2 2 x ( x ) / n 30391 ( 399 ) / 7 i i SST y 2 i r2 ( y i ) 2 n 1555.33 (97.1) 2 208.4143 7 SSR 199.0083 0.9549 SST 208.4143 (5) The 95.49% of variation in total itemized deductions can be explained by this model or by the adjusted gross income. SSE n2 SST SSR 208.4143 199.0083 1.3716 n2 72 (6) s (7) r (Sign of b1 ) r 2 0.9549 0.9772 (8) 1. H0: β1 = 0 Ha: β1 ≠ 0 2. α = 0.05 3. Test Statistic Value: SSR 199.0083 F (n 2) (7 2) 105.7880 SSE 208.4143 199.0083 4. p-Value: df1 = 1, df2 = n-2 = 5, F = 105.7880, from the F table: p-value < 0.01. 5. Reject H0 6. There is a significant relationship between the total itemized deductions and the adjusted gross income. *: Alternatively, you can use the t-test to test the same hypotheses (see Clemson Apartment Example online). (9) Confidence Interval for E(yp): 1. y p 4.67675 (0.16131)(70) 15.96845 ($15,968.45) 2. tα/2: df = n-2 = 5, the upper tail = α/2 = 0.025. From the t table, t α/2 = 2.571 3. Margin of error: s = 1.3716 (from question (6)), hp 1 n (x p x)2 xi2 ( xi ) 2 1 7 n (70 57) 2 0.16495 (399) 2 30391 7 MOE t / 2 S yˆ p t / 2 S h p (2.571)(1.3716) 0.16495 1.43221 4. Confidence interval: UCL = 15.96845 + 1.43221 = 17.40066 LCL = 15.96845 – 1.43221 = 14.53624 The 95% confidence interval for the mean total itemized deduction of all taxpayers who have $70,000 of adjusted gross income (E( y p ) ) is [$14,536.24, $17,400.66]. (10) Prediction Interval for yp: 1. y p 15.96845 ($15,968.45) 2. tn-2 = 2.571 3. Margin of error: s = 1.3716 (from question (6)), h p 0.16495 MOE t / 2 S ind t / 2 S 1 h p (2.571)(1.3716) 1 0.16495 3.8061 4. Prediction interval: UCL = 15.96845 + 3.8061 = 19.77455 LCL = 15.96845 – 3.8061 = 12.16235 The 95% prediction interval for the total itemized deduction of an individual taxpayer who has $70,000 of adjusted gross income ( y p ) is [$12,162.35, $19,774.55].

