Table 2 - Estimated percentages of female health
advertisement
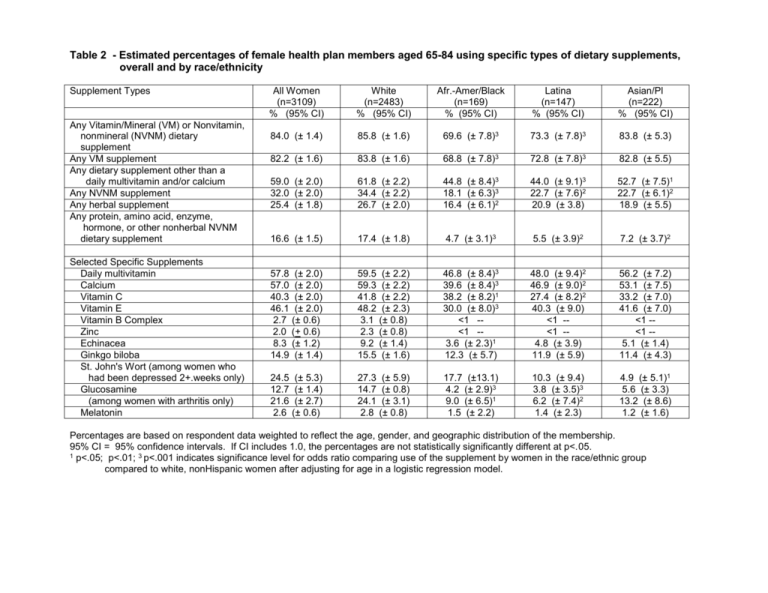
Table 2 - Estimated percentages of female health plan members aged 65-84 using specific types of dietary supplements, overall and by race/ethnicity Supplement Types Any Vitamin/Mineral (VM) or Nonvitamin, nonmineral (NVNM) dietary supplement Any VM supplement Any dietary supplement other than a daily multivitamin and/or calcium Any NVNM supplement Any herbal supplement Any protein, amino acid, enzyme, hormone, or other nonherbal NVNM dietary supplement Selected Specific Supplements Daily multivitamin Calcium Vitamin C Vitamin E Vitamin B Complex Zinc Echinacea Ginkgo biloba St. John's Wort (among women who had been depressed 2+.weeks only) Glucosamine (among women with arthritis only) Melatonin All Women (n=3109) % (95% CI) White (n=2483) % (95% CI) Afr.-Amer/Black (n=169) % (95% CI) Latina (n=147) % (95% CI) Asian/Pl (n=222) % (95% CI) 84.0 (± 1.4) 85.8 (± 1.6) 69.6 (± 7.8)3 73.3 (± 7.8)3 83.8 (± 5.3) 82.2 (± 1.6) 83.8 (± 1.6) 68.8 (± 7.8)3 72.8 (± 7.8)3 82.8 (± 5.5) 59.0 (± 2.0) 32.0 (± 2.0) 25.4 (± 1.8) 61.8 (± 2.2) 34.4 (± 2.2) 26.7 (± 2.0) 44.8 (± 8.4)3 18.1 (± 6.3)3 16.4 (± 6.1)2 44.0 (± 9.1)3 22.7 (± 7.6)2 20.9 (± 3.8) 52.7 (± 7.5)1 22.7 (± 6.1)2 18.9 (± 5.5) 16.6 (± 1.5) 17.4 (± 1.8) 4.7 (± 3.1)3 5.5 (± 3.9)2 7.2 (± 3.7)2 57.8 (± 2.0) 57.0 (± 2.0) 40.3 (± 2.0) 46.1 (± 2.0) 2.7 (± 0.6) 2.0 (+ 0.6) 8.3 (± 1.2) 14.9 (± 1.4) 59.5 (± 2.2) 59.3 (± 2.2) 41.8 (± 2.2) 48.2 (± 2.3) 3.1 (± 0.8) 2.3 (± 0.8) 9.2 (± 1.4) 15.5 (± 1.6) 46.8 (± 8.4)3 39.6 (± 8.4)3 38.2 (± 8.2)1 30.0 (± 8.0)3 <1 -<1 -3.6 (± 2.3)1 12.3 (± 5.7) 48.0 (± 9.4)2 46.9 (± 9.0)2 27.4 (± 8.2)2 40.3 (± 9.0) <1 -<1 -4.8 (± 3.9) 11.9 (± 5.9) 56.2 (± 7.2) 53.1 (± 7.5) 33.2 (± 7.0) 41.6 (± 7.0) <1 -<1 -5.1 (± 1.4) 11.4 (± 4.3) 24.5 (± 5.3) 12.7 (± 1.4) 21.6 (± 2.7) 2.6 (± 0.6) 27.3 (± 5.9) 14.7 (± 0.8) 24.1 (± 3.1) 2.8 (± 0.8) 17.7 (±13.1) 4.2 (± 2.9)3 9.0 (± 6.5)1 1.5 (± 2.2) 10.3 (± 9.4) 3.8 (± 3.5)3 6.2 (± 7.4)2 1.4 (± 2.3) 4.9 (± 5.1)1 5.6 (± 3.3) 13.2 (± 8.6) 1.2 (± 1.6) Percentages are based on respondent data weighted to reflect the age, gender, and geographic distribution of the membership. 95% CI = 95% confidence intervals. If CI includes 1.0, the percentages are not statistically significantly different at p<.05. 1 p<.05; p<.01; 3 p<.001 indicates significance level for odds ratio comparing use of the supplement by women in the race/ethnic group compared to white, nonHispanic women after adjusting for age in a logistic regression model.
