Random Effects Model Example
advertisement
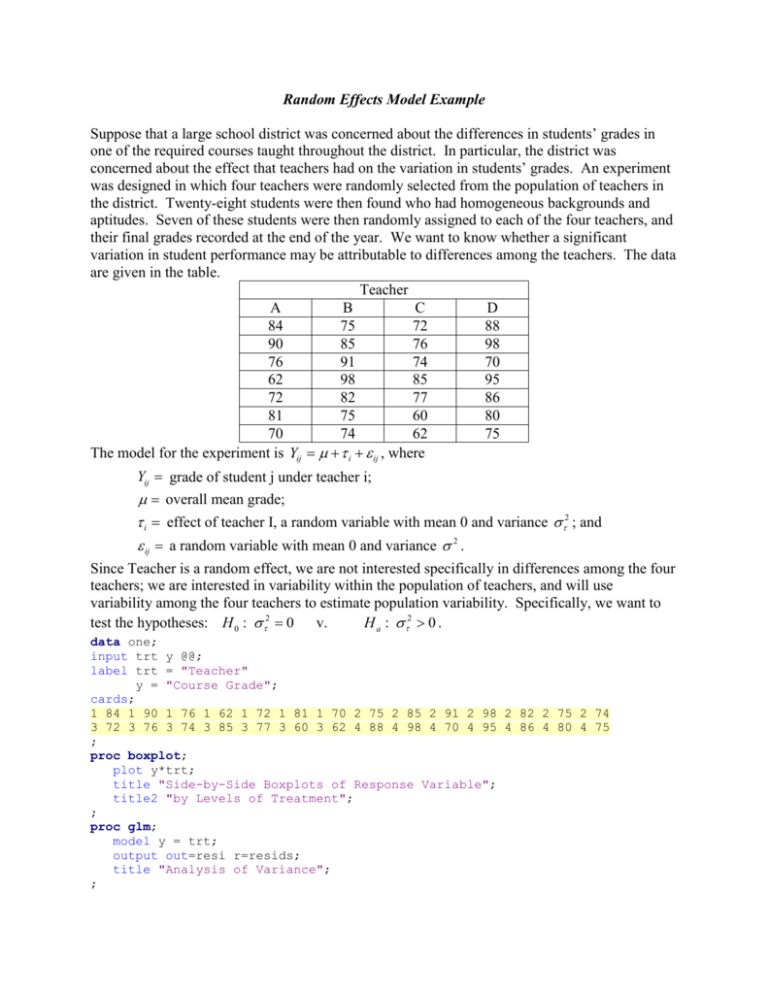
Random Effects Model Example Suppose that a large school district was concerned about the differences in students’ grades in one of the required courses taught throughout the district. In particular, the district was concerned about the effect that teachers had on the variation in students’ grades. An experiment was designed in which four teachers were randomly selected from the population of teachers in the district. Twenty-eight students were then found who had homogeneous backgrounds and aptitudes. Seven of these students were then randomly assigned to each of the four teachers, and their final grades recorded at the end of the year. We want to know whether a significant variation in student performance may be attributable to differences among the teachers. The data are given in the table. Teacher A B C D 84 75 72 88 90 85 76 98 76 91 74 70 62 98 85 95 72 82 77 86 81 75 60 80 70 74 62 75 The model for the experiment is Yij i ij , where Yij grade of student j under teacher i; overall mean grade; i effect of teacher I, a random variable with mean 0 and variance 2 ; and ij a random variable with mean 0 and variance 2 . Since Teacher is a random effect, we are not interested specifically in differences among the four teachers; we are interested in variability within the population of teachers, and will use variability among the four teachers to estimate population variability. Specifically, we want to H a : 2 0 . test the hypotheses: H 0 : 2 0 v. data one; input trt y @@; label trt = "Teacher" y = "Course Grade"; cards; 1 84 1 90 1 76 1 62 1 72 1 81 1 70 2 75 2 85 2 91 2 98 2 82 2 75 2 74 3 72 3 76 3 74 3 85 3 77 3 60 3 62 4 88 4 98 4 70 4 95 4 86 4 80 4 75 ; proc boxplot; plot y*trt; title "Side-by-Side Boxplots of Response Variable"; title2 "by Levels of Treatment"; ; proc glm; model y = trt; output out=resi r=resids; title "Analysis of Variance"; ; data two;set resi; /* The following statement creates a dummy variable with value 1 for every */ /* observation in the data set. This variable will be used to merge the sample */ /* statistics with every observation in the original data set. */ dum = 1; ; proc sort;by resids; ; proc means; var resids; output out=meanr mean=mu std=s n=size; title; title2; ; data three;set meanr;dum = 1; ; data three;merge two three;by dum; p = (_n_ - 0.5)/size; /* The following equation would need to be changed for q-q plots for other */ /* probability distributions. For example, for an exponential(mu) distribution, */ /* the statement would be Q = -mu*log(1-p). */ Q = probit(p); ; proc plot; plot resids*trt; title 'Plot of Residuals vs. Factor Levels'; ; proc reg; model resids = Q; plot (resids predicted.)*Q / overlay; title 'Normal Probability Plot'; title2 'For Residuals from ANOVA'; ; run;
