Difference in point scoring between men and women top
advertisement
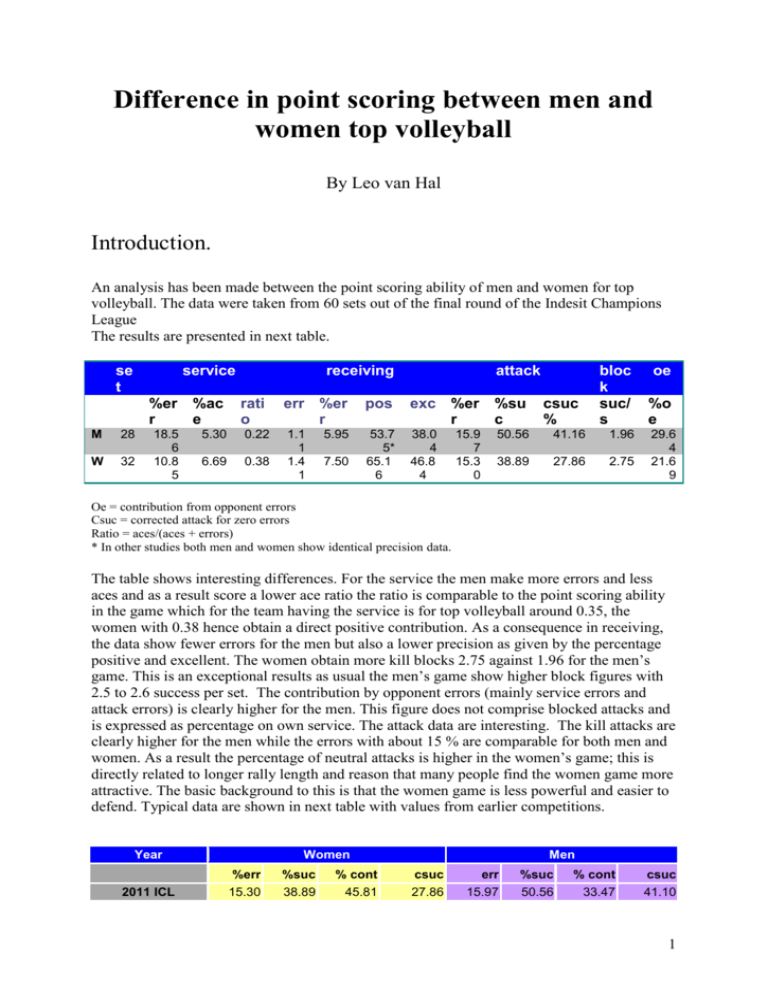
Difference in point scoring between men and women top volleyball By Leo van Hal Introduction. An analysis has been made between the point scoring ability of men and women for top volleyball. The data were taken from 60 sets out of the final round of the Indesit Champions League The results are presented in next table. se t service %er %ac r e M 28 W 32 18.5 6 10.8 5 receiving rati o 5.30 0.22 6.69 0.38 attack err %er r pos exc %er %su r c 1.1 1 1.4 1 53.7 5* 65.1 6 38.0 4 46.8 4 5.95 7.50 15.9 7 15.3 0 bloc k suc/ s csuc % 50.56 41.16 1.96 38.89 27.86 2.75 oe %o e 29.6 4 21.6 9 Oe = contribution from opponent errors Csuc = corrected attack for zero errors Ratio = aces/(aces + errors) * In other studies both men and women show identical precision data. The table shows interesting differences. For the service the men make more errors and less aces and as a result score a lower ace ratio the ratio is comparable to the point scoring ability in the game which for the team having the service is for top volleyball around 0.35, the women with 0.38 hence obtain a direct positive contribution. As a consequence in receiving, the data show fewer errors for the men but also a lower precision as given by the percentage positive and excellent. The women obtain more kill blocks 2.75 against 1.96 for the men’s game. This is an exceptional results as usual the men’s game show higher block figures with 2.5 to 2.6 success per set. The contribution by opponent errors (mainly service errors and attack errors) is clearly higher for the men. This figure does not comprise blocked attacks and is expressed as percentage on own service. The attack data are interesting. The kill attacks are clearly higher for the men while the errors with about 15 % are comparable for both men and women. As a result the percentage of neutral attacks is higher in the women’s game; this is directly related to longer rally length and reason that many people find the women game more attractive. The basic background to this is that the women game is less powerful and easier to defend. Typical data are shown in next table with values from earlier competitions. Year 2011 ICL Women Men %err %suc % cont csuc err %suc % cont csuc 15.30 38.89 45.81 27.86 15.97 50.56 33.47 41.10 1 2008 OG 14.65 41.12 44.23 31.02 16.15 47.25 36.60 37.09 2005 WGCC 13.99 40.14 45.87 30.41 16.15 47.25 36.60 37.09 2002ICL 16.44 42.48 41.08 36.43 17.38 47.48 35.14 31.16 The data show a constant difference for the neutral attacks for both men and women indicating little evolution over time in spite of the various changes in rules as the introduction of the libero. % neutral attacks 50 45 % neut W % neut M % 40 35 30 2000 2004 Year 2008 2012 . Points se t H 28 D 32 service receiving attack tot err ac e tot err po s exc tot err bl bloc k suc bl 22.8 9 21.0 3 4.2 5 2.2 8 1.2 1 1.4 1 18.6 1 18.7 5 1.1 1 1.4 1 10.0 3 11.9 9 7.04 4 8.62 25.7 1 31.6 6 2.1 4 2.0 9 1.9 6 2.7 5 13.0 0 12.3 1 o. e gpt 6.7 9 4.5 6 22.9 6 21.0 0 1.96 2.75 bl under attack are blocked attacks bl under block are block points , the figures are here equal as it involves all games oe= opponent errors as point contribution one may note a slight difference with the sum of service – and attack errors due to other bal handling errors. Gpt= game points In the following table the points are distinguished according to the result of the game indicated by won (W) or lost (L) serv set tot err ace tot receiving err %er pos exc tot attack err bl bl suc gpt oe csuc% 2 M L 21.29 4.21 1.29 20.21 1.07 5.29 11.07 8.00 26.86 2.36 2.71 11.64 1.14 20.71 6.64 30.15 M W 24.50 4.29 1.14 17.00 1.14 6.71 9.00 6.07 24.57 1.93 1.21 14.36 2.79 25.21 6.93 52.36 W L 18.06 2.38 0.62 21.81 2.19 10.04 13.12 9.69 34.31 2.37 4.19 11.56 1.31 17.69 4.25 18.02 W W 24.00 2.19 2.19 15.69 0.63 4.02 10.81 7.56 29.00 1.81 1.31 13.06 4.19 24.31 4.56 38.41 Gpt= game points The lost sets end up with 17.69 points for the women and 20.71 for the men indicating closer competition here. The attack contributes for 14.4 points for the men and 13.06 for the women. The attack hence makes the greatest contribution in points with about 56%.The second factor of importance are opponent errors with 6.93 points for the men and 4.56 for the women. The difference here can be explained by the higher service errors for the men. Aces and block points appear to be of less importance, amounting overall 5 to 10 percent of total amount of scored points. Difference in won or lost sets The table allows a second comparison between the won and lost sets. All play parameters for the women are better for the won sets than for the lost sets with an exception for the service receiving where the winners make lower precision receipts in both positive and excellent. The results of the attack are important as they produce the largest difference between the won and lost sets.1 The results for the men show better results in attack, blocking with higher contribution of the opponent errors. For the women, the winners show a very slight and worse difference in service reception. The data are averages and some parameters may show wide distributions .A typical example for the attack is given in the next graph The won sets show higher attack points, the difference between men and women is smaller for the lost sets , the men show more attack points in the won sets Similar data have been reported by David Rodriguez –Ruiz in the Journal of Quantitative Analysis in Sports. Vol7 2011 article1 1 3 20 15 ATTACKPOINTS 10 5 MW 0 L W men wom WL . 12 10 Opp..Errors 8 6 4 2 0 L WL W men wom 4 7 6 5 4 aces 3 2 1 0 L WL W men wom 8 7 6 Block points 5 4 3 2 1 0 L WL W men wom Most of the data show important overlap between men and women but also between won and lost sets. It appears however that the attack is an important variable. The relation between attack as % suc and game points is shown in the following graph. It is shown that in the men game a minimum success percentage of 35 to 40 % could be sufficient to win a set or to reach 25 game points, while a higher result of around 55 % is required for the women 5 70 60 50 SUC 40 30 20 10 15 20 WPT 25 men wom 30 There are similar relations for the other variables; the correlation table is given next for the point scoring items. Attack and block appear to be dominant variables the precision receiving data do not show any significant correlation. Corr.coef csuc GPT 0.714 % suc 0.657 block 0.536 %oe 0.018 %ace 0.018 pos 0.127 exc 0.03 The errors are negatively correlated with game points as shown in next table Corr.coef Serve err GPT -0.089 Rec. err Att err. -0.177 -0.566 Discriminant analyses. 6 A discriminant analyses 2indicates that won or lost sets can be separated by the play parameters in which the attack is the most dominant. The results for the men with corrected attack and block are shown in following graph. Men data 6 5 BLK 4 3 2 WL 1 0 0 20 40 60 net attack ( csuc) 80 L W In order to win a set one should have at least 45% success in the attack and than there are still three exceptions in particular when there is not enough support from blocking points A help graph for passing from the percent success in attack to the to zero corrected attack data is shown next. 2 The Unscrabler Camo 7 relation between %suc and csuc for men and women 70 %suc 60 50 40 30 20 0 MWO 20 40 60 net attack ( csuc) 80 men wom . A final graph showing the data for women is next, it is confirmed here that in the women game a lower attack result is sufficient to win a set. Contributions from other variables such as aces or opponent errors will reduce the minimum required attack result.. The graph is given for attack and block. The graph confirms that in the women game a lower attack result can be sufficient to win set Women Data 8 8 7 6 block 5 4 3 2 WL 1 0 0 10 20 30 40 50 %suc in attack 60 L W Point distribution. The men game shows higher values for the game points and the points obtained via the opponent errors The attack points are near equal. All point scoring items show no influence of set numbers with an exception for the aces where the values are slightlty increasing.. No values for fifth sets are given because of too low number of observations, 9 point distribution 25 points 20 15 10 5 0 1 2 a tt M a tt W 3 gp t M set no g p tW ac e M ac e W 4 oe M oe W 10 Explanation for the use of corrected attack score (csuc%) Team A having the service can score a point by the sequence x*Y and Z with following definitions Neutral attack 0 Error attack Kill attack + Team A x z y Team B X Z Y Sequence 0+ , 000+, 00000+ is the equivalent to X*y/ (1-x*X) …..(1) 3 but also in case of an error of team B - ,00-,0000which can be written as x*Y/(1-x*X) ….(2) When both teams are of equal strength following relation should hold X*y +Z = x*Y When it is further assumed that team A makes no errors and after substitution of 1= x+ y + z and or 1=Y+X following equation is obtained (1-Y)*y+Z =(1-y-z)*Y And after simplification, y-z =Y*(1-z) or Y= y-z/(1-z) This is the relation which is used to calculate csuc , the too zero error corrected attack result. . 3 Sum of geometrical series. 11
